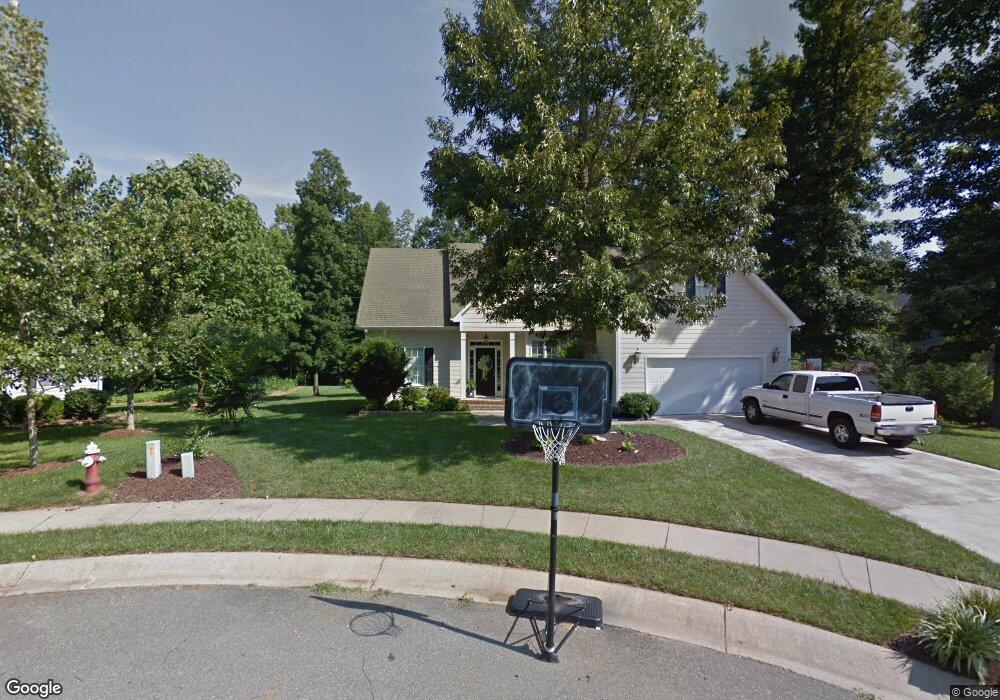
502 Stonewall Dr Mebane, NC 27302
Estimated Value: $416,083 - $446,000
4
Beds
3
Baths
2,167
Sq Ft
$200/Sq Ft
Est. Value
About This Home
This home is located at 502 Stonewall Dr, Mebane, NC 27302 and is currently estimated at $432,521, approximately $199 per square foot. 502 Stonewall Dr is a home located in Alamance County with nearby schools including South Mebane Elementary School, Woodlawn Middle School, and Eastern Alamance High School.
Ownership History
Date
Name
Owned For
Owner Type
Purchase Details
Closed on
Mar 2, 2008
Sold by
Deanhardt Cory H
Bought by
Hollenbach Terry L
Current Estimated Value
Purchase Details
Closed on
Feb 25, 2008
Sold by
Prudential Relocation Inc
Bought by
Aldridge Roger Brian
Purchase Details
Closed on
Feb 13, 2008
Sold by
Hollenbach Terry L
Bought by
Prudential Relocation Inc
Purchase Details
Closed on
Mar 2, 2007
Sold by
Deanhardt Cory H
Bought by
Hollenback Terry I
Home Financials for this Owner
Home Financials are based on the most recent Mortgage that was taken out on this home.
Original Mortgage
$158,000
Interest Rate
6.16%
Mortgage Type
New Conventional
Purchase Details
Closed on
May 14, 2003
Sold by
Shanklin Bldrs Inc
Bought by
Deanhardt Cory
Home Financials for this Owner
Home Financials are based on the most recent Mortgage that was taken out on this home.
Original Mortgage
$168,150
Interest Rate
5.76%
Mortgage Type
New Conventional
Create a Home Valuation Report for This Property
The Home Valuation Report is an in-depth analysis detailing your home's value as well as a comparison with similar homes in the area
Home Values in the Area
Average Home Value in this Area
Purchase History
| Date | Buyer | Sale Price | Title Company |
|---|---|---|---|
| Hollenbach Terry L | $229,000 | -- | |
| Aldridge Roger Brian | $200,000 | -- | |
| Prudential Relocation Inc | $230,000 | -- | |
| Hollenback Terry I | $229,000 | -- | |
| Deanhardt Cory | $32,000 | -- |
Source: Public Records
Mortgage History
| Date | Status | Borrower | Loan Amount |
|---|---|---|---|
| Previous Owner | Hollenback Terry I | $158,000 | |
| Previous Owner | Deanhardt Cory | $168,150 |
Source: Public Records
Tax History Compared to Growth
Tax History
| Year | Tax Paid | Tax Assessment Tax Assessment Total Assessment is a certain percentage of the fair market value that is determined by local assessors to be the total taxable value of land and additions on the property. | Land | Improvement |
|---|---|---|---|---|
| 2025 | $3,611 | $417,895 | $65,000 | $352,895 |
| 2024 | $3,506 | $417,895 | $65,000 | $352,895 |
| 2023 | $3,335 | $417,895 | $65,000 | $352,895 |
| 2022 | $2,518 | $225,916 | $40,000 | $185,916 |
| 2021 | $2,540 | $225,916 | $40,000 | $185,916 |
| 2020 | $2,563 | $225,916 | $40,000 | $185,916 |
| 2019 | $2,575 | $225,916 | $40,000 | $185,916 |
| 2018 | $0 | $225,916 | $40,000 | $185,916 |
| 2017 | $2,372 | $225,916 | $40,000 | $185,916 |
| 2016 | $2,334 | $218,135 | $35,000 | $183,135 |
| 2015 | $1,259 | $218,135 | $35,000 | $183,135 |
| 2014 | $1,150 | $218,135 | $35,000 | $183,135 |
Source: Public Records
Map
Nearby Homes
- 0 Roosevelt St
- 456 Stonewall Dr
- 714 W Mckinley St
- 1005 Stuart Dr
- 213 Beauregard Ln
- 413 Mckinley Place
- 307 W Austin St
- 0 Smith Dr
- 109 Briarwood Dr
- 426 Fitch Dr
- 421 W Holt St
- 0 Dyson Dr Unit TBD Dyson 2519207
- 415 S Third St
- 308 W Jackson St
- 619 S Fifth St
- 0 S Fifth St
- # 0 S Fifth St
- 1107 Briarwood Dr
- 36 London Ln
- 402 W Clay St
- 500 Stonewall Dr
- 504 Stonewall Dr
- 506 Stonewall Dr
- 498 Stonewall Dr
- 505 Stonewall Dr
- 503 Stonewall Dr
- 501 Stonewall Dr
- 496 Stonewall Dr
- 511 Hill Ln
- 488 Stonewall Dr
- 514 Hill Ln
- 512 Hill Ln
- 510 Hill Ln
- 465 Stonewall Dr
- 472 Stonewall Dr
- 509 Hill Ln
- 713 Roosevelt St
- 717 Roosevelt St
- 719 Roosevelt St
- 721 Roosevelt St