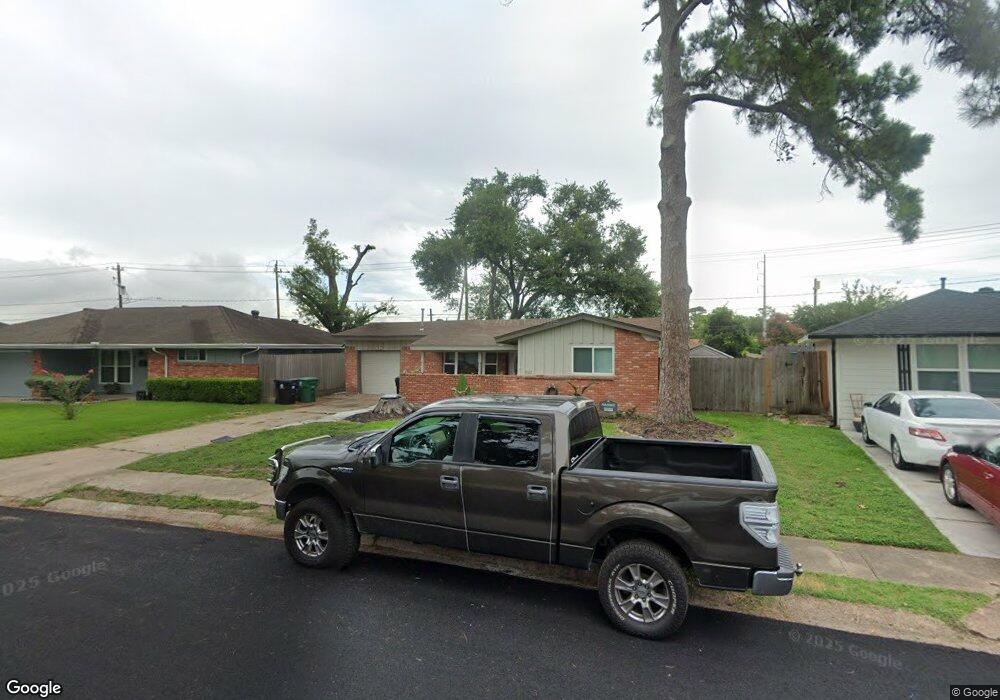
5022 De Lange Ln Houston, TX 77092
Oak Forest-Garden Oaks NeighborhoodEstimated Value: $313,000 - $382,000
3
Beds
2
Baths
1,120
Sq Ft
$313/Sq Ft
Est. Value
About This Home
This home is located at 5022 De Lange Ln, Houston, TX 77092 and is currently estimated at $350,005, approximately $312 per square foot. 5022 De Lange Ln is a home located in Harris County with nearby schools including Clifton Middle, Scarborough High School, and KIPP Nexus Primary School.
Ownership History
Date
Name
Owned For
Owner Type
Purchase Details
Closed on
Nov 30, 2017
Sold by
S&S Texas Properties Llc
Bought by
Carranza Robert G and Carranza Melanie D
Current Estimated Value
Home Financials for this Owner
Home Financials are based on the most recent Mortgage that was taken out on this home.
Original Mortgage
$221,807
Outstanding Balance
$187,604
Interest Rate
4.12%
Mortgage Type
FHA
Estimated Equity
$162,401
Purchase Details
Closed on
Nov 20, 2015
Sold by
Bencal Minette
Bought by
S & S Texas Properties Llc
Home Financials for this Owner
Home Financials are based on the most recent Mortgage that was taken out on this home.
Original Mortgage
$162,000
Interest Rate
3.85%
Purchase Details
Closed on
Oct 22, 1996
Sold by
Liljestrand Chester A and Liljestrand Linda Joyce
Bought by
Bencal Minette
Home Financials for this Owner
Home Financials are based on the most recent Mortgage that was taken out on this home.
Original Mortgage
$61,100
Interest Rate
8.17%
Create a Home Valuation Report for This Property
The Home Valuation Report is an in-depth analysis detailing your home's value as well as a comparison with similar homes in the area
Home Values in the Area
Average Home Value in this Area
Purchase History
| Date | Buyer | Sale Price | Title Company |
|---|---|---|---|
| Carranza Robert G | -- | None Available | |
| S & S Texas Properties Llc | -- | South Land Title Llc | |
| Bencal Minette | -- | -- |
Source: Public Records
Mortgage History
| Date | Status | Borrower | Loan Amount |
|---|---|---|---|
| Open | Carranza Robert G | $221,807 | |
| Previous Owner | S & S Texas Properties Llc | $162,000 | |
| Previous Owner | Bencal Minette | $61,100 |
Source: Public Records
Tax History Compared to Growth
Tax History
| Year | Tax Paid | Tax Assessment Tax Assessment Total Assessment is a certain percentage of the fair market value that is determined by local assessors to be the total taxable value of land and additions on the property. | Land | Improvement |
|---|---|---|---|---|
| 2025 | $5,191 | $379,169 | $240,848 | $138,321 |
| 2024 | $5,191 | $361,354 | $240,848 | $120,506 |
| 2023 | $5,191 | $331,442 | $240,848 | $90,594 |
| 2022 | $6,919 | $314,211 | $203,216 | $110,995 |
| 2021 | $6,872 | $294,846 | $188,163 | $106,683 |
| 2020 | $6,860 | $283,281 | $188,163 | $95,118 |
| 2019 | $6,755 | $296,750 | $188,163 | $108,587 |
| 2018 | $4,636 | $242,699 | $188,163 | $54,536 |
| 2017 | $6,966 | $275,507 | $188,163 | $87,344 |
| 2016 | $5,695 | $225,246 | $188,163 | $37,083 |
| 2015 | $2,173 | $190,393 | $150,530 | $39,863 |
| 2014 | $2,173 | $130,730 | $90,318 | $40,412 |
Source: Public Records
Map
Nearby Homes
- 5110 Verdome Ln
- 5025 De Milo Dr
- 4917 Randon Rd
- 4922 Hoover St Unit A
- 4922 Hoover St Unit F
- 4922 Hoover St Unit E
- 4921 Randon Rd
- 5109 Lido Ln
- 5313 De Lange Ln
- 4725 Carleen Rd
- 4323 Mangum Rd
- 5037 W 43rd St
- 4309 Costa Rica Rd
- 5029 Broom St Unit A
- 5029 Broom St Unit C
- 5029 Broom St Unit B
- 4913 W 43rd St
- 5414 Broom St
- 5217 W 43rd St
- 4801 Sanborn Dr
- 5026 De Lange Ln
- 5018 De Lange Ln
- 5030 De Lange Ln
- 5014 De Lange Ln
- 5017 De Lange Ln
- 5021 De Lange Ln
- 5034 De Lange Ln
- 5010 De Lange Ln
- 5029 De Lange Ln
- 5038 De Lange Ln
- 5033 De Lange Ln
- 5006 De Lange Ln
- 5024 Verdome Ln
- 5028 Verdome Ln
- 5016 Verdome Ln
- 5037 De Lange Ln
- 5032 Verdome Ln
- 5036 Verdome Ln
- 5002 De Lange Ln
- 5102 De Lange Ln