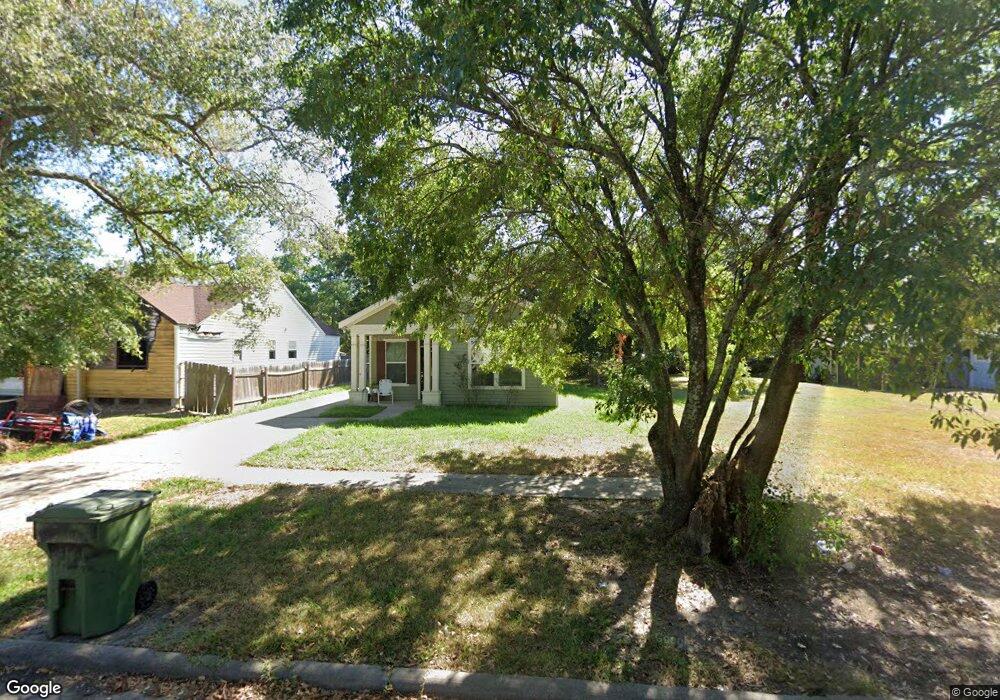
5024 8th St Port Arthur, TX 77642
Estimated Value: $52,000 - $126,000
--
Bed
--
Bath
1,300
Sq Ft
$75/Sq Ft
Est. Value
About This Home
This home is located at 5024 8th St, Port Arthur, TX 77642 and is currently estimated at $97,962, approximately $75 per square foot. 5024 8th St is a home located in Jefferson County with nearby schools including Travis Elementary School, Jefferson Middle School, and Memorial High School.
Ownership History
Date
Name
Owned For
Owner Type
Purchase Details
Closed on
Jan 13, 2016
Sold by
Torres Gloria and Castro Gloria
Bought by
Hernandez Jasmine Anais and Castro Ana
Current Estimated Value
Purchase Details
Closed on
Dec 20, 2004
Sold by
Corbin Margaret Sable
Bought by
Torres Jose Luis Castro and Torres Gloria
Purchase Details
Closed on
Oct 26, 2000
Sold by
Corbin Margaret Sable
Bought by
Torres Jose Luis Castro and Torres Gloria
Home Financials for this Owner
Home Financials are based on the most recent Mortgage that was taken out on this home.
Original Mortgage
$9,500
Interest Rate
15%
Mortgage Type
Seller Take Back
Create a Home Valuation Report for This Property
The Home Valuation Report is an in-depth analysis detailing your home's value as well as a comparison with similar homes in the area
Home Values in the Area
Average Home Value in this Area
Purchase History
| Date | Buyer | Sale Price | Title Company |
|---|---|---|---|
| Hernandez Jasmine Anais | -- | None Available | |
| Torres Jose Luis Castro | -- | -- | |
| Torres Jose Luis Castro | $13,500 | -- |
Source: Public Records
Mortgage History
| Date | Status | Borrower | Loan Amount |
|---|---|---|---|
| Previous Owner | Torres Jose Luis Castro | $9,500 |
Source: Public Records
Tax History Compared to Growth
Tax History
| Year | Tax Paid | Tax Assessment Tax Assessment Total Assessment is a certain percentage of the fair market value that is determined by local assessors to be the total taxable value of land and additions on the property. | Land | Improvement |
|---|---|---|---|---|
| 2025 | $213 | $106,997 | -- | -- |
| 2024 | $213 | $97,270 | -- | -- |
| 2023 | $213 | $88,427 | $0 | $0 |
| 2022 | $2,553 | $80,388 | $0 | $0 |
| 2021 | $2,422 | $106,038 | $2,400 | $103,638 |
| 2020 | $75 | $66,436 | $2,400 | $64,036 |
| 2019 | $2,118 | $66,440 | $2,400 | $64,040 |
| 2018 | $72 | $66,440 | $2,400 | $64,040 |
| 2017 | $61 | $66,440 | $2,400 | $64,040 |
| 2016 | $1,946 | $66,440 | $2,400 | $64,040 |
| 2015 | -- | $36,540 | $2,400 | $34,140 |
| 2014 | -- | $36,540 | $2,400 | $34,140 |
Source: Public Records
Map
Nearby Homes