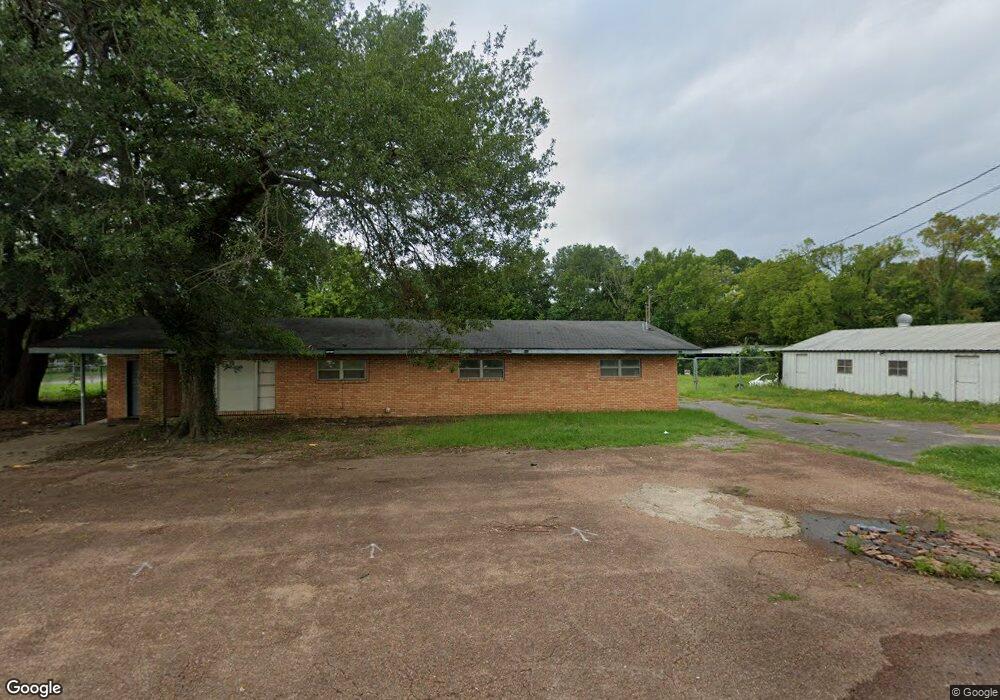
503 Locke St Lufkin, TX 75901
--
Bed
1
Bath
6,413
Sq Ft
0.95
Acres
About This Home
This home is located at 503 Locke St, Lufkin, TX 75901. 503 Locke St is a home located in Angelina County with nearby schools including Herty Primary School, Coston Elementary School, and Lufkin Middle School.
Ownership History
Date
Name
Owned For
Owner Type
Purchase Details
Closed on
Feb 19, 2016
Sold by
Syler Lindsay Rae and Syler Lindsay R
Bought by
Aah Land Holdings Llc
Home Financials for this Owner
Home Financials are based on the most recent Mortgage that was taken out on this home.
Original Mortgage
$3,118,800
Outstanding Balance
$2,289,880
Interest Rate
3.97%
Mortgage Type
Commercial
Purchase Details
Closed on
Jun 5, 2015
Sold by
Salas Dr D W and Salas Daniel W
Bought by
Syler Dr Lindsay Rae
Home Financials for this Owner
Home Financials are based on the most recent Mortgage that was taken out on this home.
Original Mortgage
$235,000
Interest Rate
3.68%
Mortgage Type
Seller Take Back
Purchase Details
Closed on
Sep 19, 2014
Sold by
American Capital Group Llc
Bought by
Syler Lindsay R
Home Financials for this Owner
Home Financials are based on the most recent Mortgage that was taken out on this home.
Original Mortgage
$150,560
Interest Rate
4.18%
Mortgage Type
Commercial
Create a Home Valuation Report for This Property
The Home Valuation Report is an in-depth analysis detailing your home's value as well as a comparison with similar homes in the area
Home Values in the Area
Average Home Value in this Area
Purchase History
| Date | Buyer | Sale Price | Title Company |
|---|---|---|---|
| Aah Land Holdings Llc | -- | None Available | |
| Syler Dr Lindsay Rae | -- | None Available | |
| Syler Lindsay R | -- | None Available |
Source: Public Records
Mortgage History
| Date | Status | Borrower | Loan Amount |
|---|---|---|---|
| Open | Aah Land Holdings Llc | $3,118,800 | |
| Previous Owner | Syler Dr Lindsay Rae | $235,000 | |
| Previous Owner | Syler Lindsay R | $150,560 |
Source: Public Records
Tax History Compared to Growth
Tax History
| Year | Tax Paid | Tax Assessment Tax Assessment Total Assessment is a certain percentage of the fair market value that is determined by local assessors to be the total taxable value of land and additions on the property. | Land | Improvement |
|---|---|---|---|---|
| 2025 | $2,789 | $133,450 | $17,150 | $116,300 |
| 2024 | $2,874 | $137,520 | $17,150 | $120,370 |
| 2023 | $2,813 | $141,570 | $17,150 | $124,420 |
| 2022 | $2,704 | $118,730 | $6,000 | $112,730 |
| 2021 | $2,227 | $90,400 | $6,000 | $84,400 |
| 2020 | $1,265 | $51,480 | $6,000 | $45,480 |
| 2019 | $1,301 | $50,040 | $6,000 | $44,040 |
| 2018 | $1,951 | $50,040 | $6,000 | $44,040 |
| 2017 | $1,951 | $81,820 | $6,000 | $75,820 |
| 2016 | $739 | $30,980 | $6,000 | $24,980 |
| 2015 | $791 | $30,980 | $6,000 | $24,980 |
| 2014 | $791 | $30,980 | $6,000 | $24,980 |
Source: Public Records
Map
Nearby Homes
- 521 N 1st St
- 505 N 1st St
- 1618 Paul Ave
- 115 Ward St
- 1101 N 1st St
- 322 Montrose St
- 301 Culverhouse St
- 1911 Paul Ave
- 333 Humason Ave
- 329 Humason Ave
- TBD State Highway 103
- 1504 May St
- 408 Bob St
- 420 Mantooth Ave
- 417 Stark St
- 417 Martin Luther King jr Blvd
- 607 Humason Ave
- 902 Cain St
- 318 Lake Alley
- Lt 5.2 & 6 Treadwell Ave