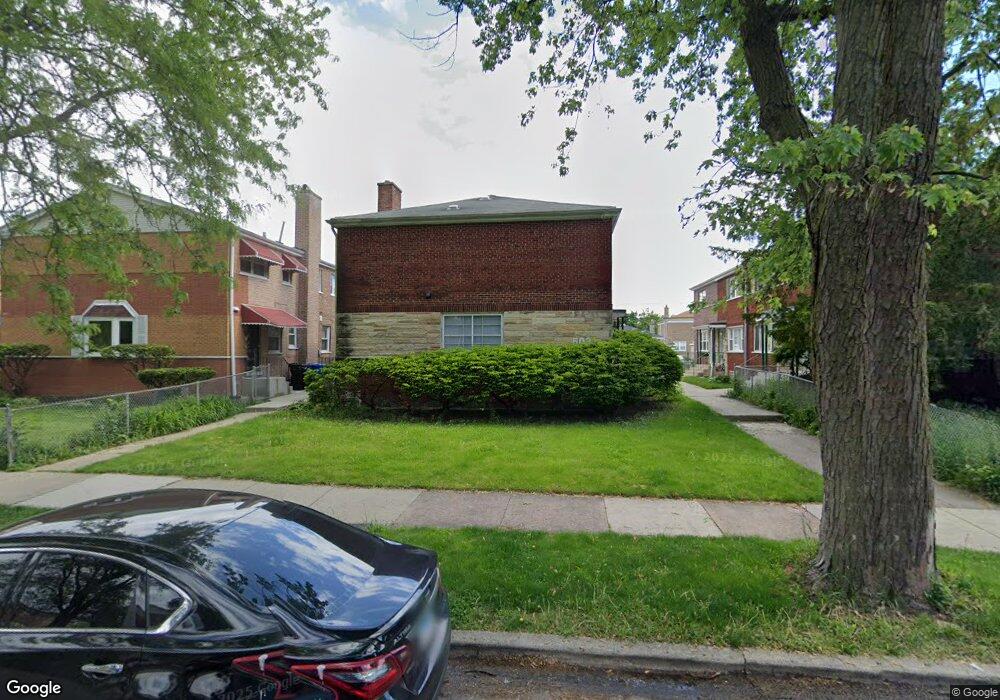
5035 W Jackson Blvd Unit D Chicago, IL 60644
Austin NeighborhoodEstimated Value: $103,000 - $147,000
2
Beds
2
Baths
1,090
Sq Ft
$115/Sq Ft
Est. Value
About This Home
This home is located at 5035 W Jackson Blvd Unit D, Chicago, IL 60644 and is currently estimated at $125,406, approximately $115 per square foot. 5035 W Jackson Blvd Unit D is a home located in Cook County with nearby schools including Leland Elementary School, KIPP Academy Chicago Campus, and Chicago Jesuit Academy.
Ownership History
Date
Name
Owned For
Owner Type
Purchase Details
Closed on
Jul 30, 2021
Sold by
Sweet Home Chicago Management Llc
Bought by
Cerberus Re Llc
Current Estimated Value
Home Financials for this Owner
Home Financials are based on the most recent Mortgage that was taken out on this home.
Original Mortgage
$75,000
Interest Rate
2.8%
Mortgage Type
Purchase Money Mortgage
Purchase Details
Closed on
Mar 6, 2019
Sold by
Cook County
Bought by
Sweet Home Chicago Management Llc
Purchase Details
Closed on
Aug 21, 2013
Sold by
Cook County Clerk
Bought by
Popular Real Estate Inc
Purchase Details
Closed on
May 20, 2005
Sold by
Lee Susan W and Stokes Kathy
Bought by
James Darlene
Home Financials for this Owner
Home Financials are based on the most recent Mortgage that was taken out on this home.
Original Mortgage
$70,300
Interest Rate
6.75%
Mortgage Type
Unknown
Create a Home Valuation Report for This Property
The Home Valuation Report is an in-depth analysis detailing your home's value as well as a comparison with similar homes in the area
Home Values in the Area
Average Home Value in this Area
Purchase History
| Date | Buyer | Sale Price | Title Company |
|---|---|---|---|
| Cerberus Re Llc | $100,000 | Chicago Title Insurance Co | |
| Sweet Home Chicago Management Llc | -- | None Available | |
| Popular Real Estate Inc | -- | None Available | |
| James Darlene | $88,000 | Ticor Title Insurance Compan |
Source: Public Records
Mortgage History
| Date | Status | Borrower | Loan Amount |
|---|---|---|---|
| Previous Owner | Cerberus Re Llc | $75,000 | |
| Previous Owner | James Darlene | $70,300 | |
| Closed | James Darlene | $17,600 |
Source: Public Records
Tax History Compared to Growth
Tax History
| Year | Tax Paid | Tax Assessment Tax Assessment Total Assessment is a certain percentage of the fair market value that is determined by local assessors to be the total taxable value of land and additions on the property. | Land | Improvement |
|---|---|---|---|---|
| 2024 | $1,564 | $9,500 | $2,110 | $7,390 |
| 2023 | $1,851 | $7,414 | $1,715 | $5,699 |
| 2022 | $1,851 | $9,000 | $1,715 | $7,285 |
| 2021 | $1,140 | $8,999 | $1,714 | $7,285 |
| 2020 | $1,083 | $7,965 | $1,714 | $6,251 |
| 2019 | $1,089 | $8,851 | $1,714 | $7,137 |
| 2018 | $1,070 | $8,851 | $1,714 | $7,137 |
| 2017 | $840 | $7,278 | $1,516 | $5,762 |
| 2016 | $958 | $7,278 | $1,516 | $5,762 |
| 2015 | $853 | $7,278 | $1,516 | $5,762 |
| 2014 | $842 | $7,107 | $1,450 | $5,657 |
| 2013 | $814 | $7,107 | $1,450 | $5,657 |
Source: Public Records
Map
Nearby Homes
- 5100 W Quincy St
- 5065 W Gladys Ave Unit C
- 4918 W Monroe St
- 4935 W Monroe St
- 5092 W Monroe St
- 4910 W Gladys Ave
- 4856 W Jackson Blvd
- 5125 W Monroe St
- 5068 W Congress Pkwy
- 4607 W Madison St
- 4948 W Washington Blvd
- 5153 W Washington Blvd
- 4747 W Monroe St
- 5246 W Congress Pkwy
- 5005 W West End Ave
- 4832 W Harrison St
- 4821 W Washington Blvd
- 4733 W Gladys Ave
- 1100 S Menard St
- 4855 W Jackson Blvd
- 5035 W Jackson Blvd
- 5035 W Jackson Blvd
- 5035 W Jackson Blvd
- 5035 W Jackson Blvd Unit B
- 5029 W Jackson Blvd
- 5029 W Jackson Blvd
- 5029 W Jackson Blvd
- 5029 W Jackson Blvd
- 5029 W Jackson Blvd Unit B
- 5039 W Jackson Blvd
- 5039 W Jackson Blvd
- 5039 W Jackson Blvd
- 5039 W Jackson Blvd
- 5043 W Jackson Blvd
- 5043 W Jackson Blvd
- 5043 W Jackson Blvd
- 5043 W Jackson Blvd
- 5043 W Jackson Blvd Unit D
- 5043 W Jackson Blvd Unit A
- 5023 W Jackson Blvd