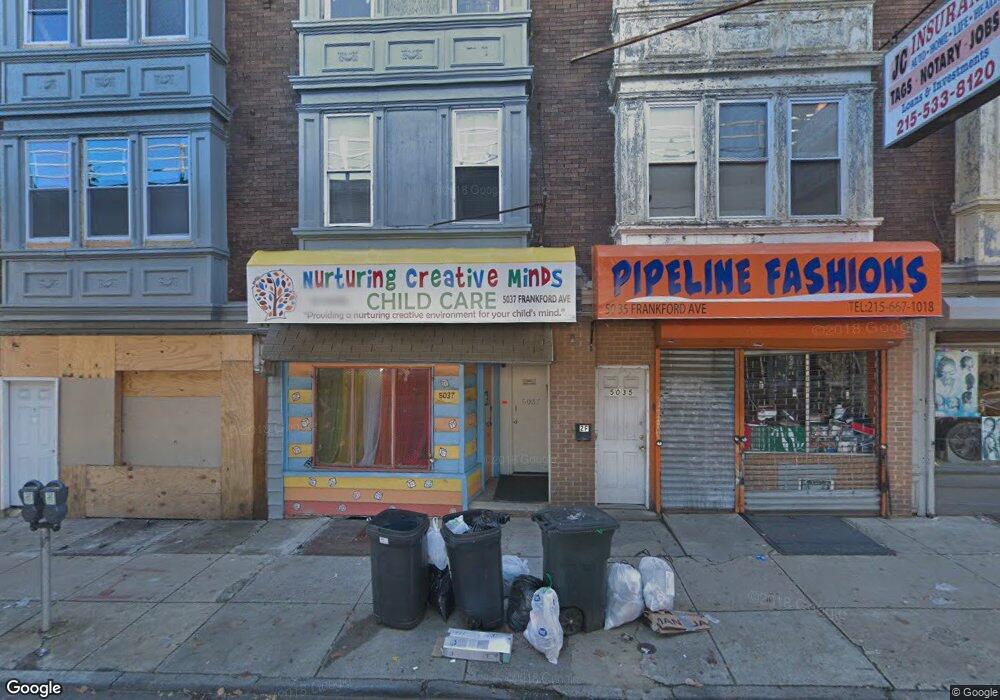
5037 Frankford Ave Unit 3 Philadelphia, PA 19124
Frankford NeighborhoodEstimated Value: $243,501
4
Beds
2
Baths
2,618
Sq Ft
$93/Sq Ft
Est. Value
About This Home
This home is located at 5037 Frankford Ave Unit 3, Philadelphia, PA 19124 and is currently estimated at $243,501, approximately $93 per square foot. 5037 Frankford Ave Unit 3 is a home located in Philadelphia County with nearby schools including Harding Warren G Middle School, Frankford High School, and Mastery Schools Smedley Elementary.
Ownership History
Date
Name
Owned For
Owner Type
Purchase Details
Closed on
Dec 12, 2013
Sold by
He Zhi Qiang
Bought by
Florence Investments Llc
Current Estimated Value
Home Financials for this Owner
Home Financials are based on the most recent Mortgage that was taken out on this home.
Original Mortgage
$100,000
Interest Rate
4.15%
Mortgage Type
Commercial
Purchase Details
Closed on
Feb 8, 2012
Sold by
Qiang He Zhi and Chen Sai Zhen
Bought by
Qiang He Zhi
Purchase Details
Closed on
Aug 16, 2001
Sold by
Devine Thomas P and Marr Kenneth M
Bought by
Deluca Henry
Home Financials for this Owner
Home Financials are based on the most recent Mortgage that was taken out on this home.
Original Mortgage
$47,500
Interest Rate
7.06%
Mortgage Type
Seller Take Back
Purchase Details
Closed on
Jul 13, 1995
Sold by
Kleininger Theresa and Kleininger Frank J
Bought by
Marr Kenneth M and Devine Thomas P
Create a Home Valuation Report for This Property
The Home Valuation Report is an in-depth analysis detailing your home's value as well as a comparison with similar homes in the area
Home Values in the Area
Average Home Value in this Area
Purchase History
| Date | Buyer | Sale Price | Title Company |
|---|---|---|---|
| Florence Investments Llc | $110,000 | None Available | |
| Qiang He Zhi | -- | None Available | |
| Deluca Henry | $47,500 | Lawyers Title Insurance Corp | |
| Marr Kenneth M | $65,000 | -- |
Source: Public Records
Mortgage History
| Date | Status | Borrower | Loan Amount |
|---|---|---|---|
| Closed | Florence Investments Llc | $100,000 | |
| Previous Owner | Deluca Henry | $47,500 |
Source: Public Records
Tax History Compared to Growth
Tax History
| Year | Tax Paid | Tax Assessment Tax Assessment Total Assessment is a certain percentage of the fair market value that is determined by local assessors to be the total taxable value of land and additions on the property. | Land | Improvement |
|---|---|---|---|---|
| 2026 | $1,407 | $98,200 | $19,640 | $78,560 |
| 2025 | $1,407 | $98,200 | $19,640 | $78,560 |
| 2024 | $1,407 | $98,200 | $19,640 | $78,560 |
| 2023 | $1,407 | $100,500 | $20,100 | $80,400 |
| 2022 | $1,445 | $100,500 | $20,100 | $80,400 |
| 2021 | $1,445 | $0 | $0 | $0 |
| 2020 | $1,445 | $0 | $0 | $0 |
| 2019 | $1,431 | $0 | $0 | $0 |
| 2018 | $1,390 | $0 | $0 | $0 |
| 2017 | $1,746 | $0 | $0 | $0 |
| 2016 | $1,746 | $0 | $0 | $0 |
| 2015 | $1,671 | $0 | $0 | $0 |
| 2014 | -- | $124,700 | $15,720 | $108,980 |
Source: Public Records
Map
Nearby Homes
- 1539 Dyre St
- 1651 Conklin St
- 5020 Griscom St
- 1538 Pratt St
- 5103 Duffield St
- 4941 Penn St
- 4943 Duffield St
- 2015 Granite St
- 4925 Penn St
- 1641 Granite St
- 5009 Hawthorne St
- 1644 Bridge St
- 1615 Fillmore St
- 5201 Hawthorne St
- 1636 Fillmore St
- 4839 Griscom St
- 4942 Mulberry St
- 1665 Bridge St
- 4843 Duffield St
- 4938 Mulberry St
- 5037 Frankford Ave
- 5039 Frankford Ave
- 5035 Frankford Ave
- 5031 Frankford Ave
- 5029 Frankford Ave
- 1610 Dyre St Unit SRO-2F
- 1610 Dyre St Unit B3
- 1610 Dyre St Unit A2
- 1610 Dyre St Unit A3
- 1610 Dyre St Unit B2
- 1610 Dyre St
- 1610 Dyre St Unit 3F
- 1610 Dyre St Unit 2F
- 1610 Dyre St Unit 3R
- 1610 Dyre St Unit 2R
- 1610 Dyre St Unit 2M
- 1610 Dyre St Unit 1R
- 1610 Dyre St Unit 1F
- 1610 Dyre St Unit 1M
- 5027 Frankford Ave