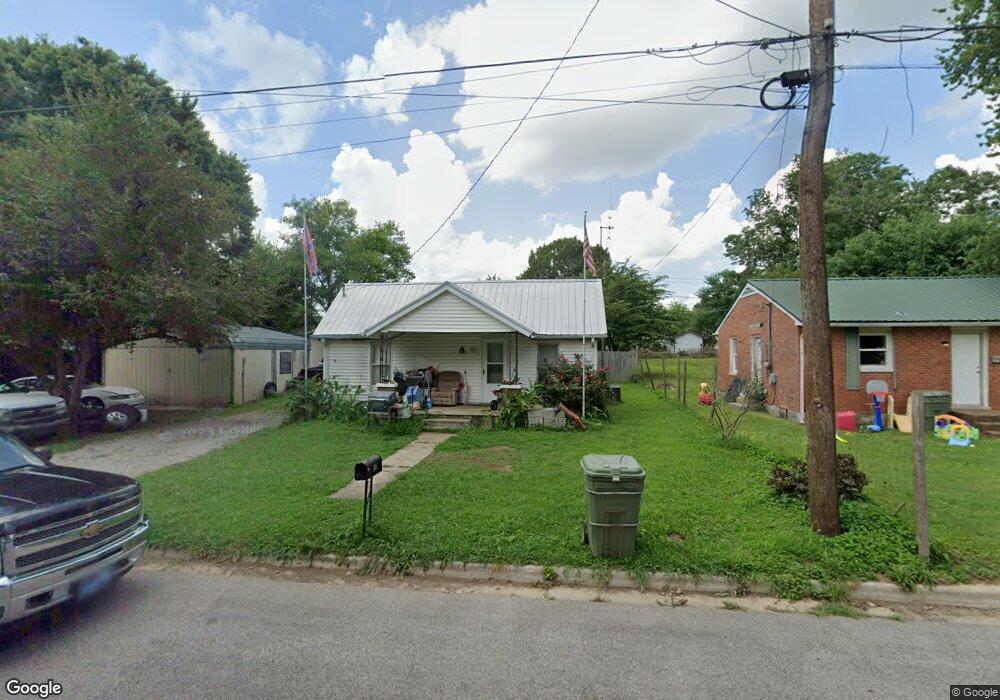
504 6th St Lawrenceburg, TN 38464
Estimated Value: $59,000 - $163,000
--
Bed
1
Bath
994
Sq Ft
$102/Sq Ft
Est. Value
About This Home
This home is located at 504 6th St, Lawrenceburg, TN 38464 and is currently estimated at $101,578, approximately $102 per square foot. 504 6th St is a home located in Lawrence County with nearby schools including Ingram Sowell Elementary School, Lawrenceburg Public Elementary School, and David Crockett Elementary School.
Ownership History
Date
Name
Owned For
Owner Type
Purchase Details
Closed on
Apr 24, 2007
Sold by
Fannie Mae
Bought by
Henson Albert J
Current Estimated Value
Home Financials for this Owner
Home Financials are based on the most recent Mortgage that was taken out on this home.
Original Mortgage
$22,916
Outstanding Balance
$2,995
Interest Rate
6.12%
Estimated Equity
$98,583
Purchase Details
Closed on
Oct 23, 2006
Bought by
Federal National Mortgage Two Galleria Tower
Purchase Details
Closed on
May 29, 1984
Bought by
Rankin Thomas
Purchase Details
Closed on
Jan 1, 1984
Create a Home Valuation Report for This Property
The Home Valuation Report is an in-depth analysis detailing your home's value as well as a comparison with similar homes in the area
Home Values in the Area
Average Home Value in this Area
Purchase History
| Date | Buyer | Sale Price | Title Company |
|---|---|---|---|
| Henson Albert J | $28,000 | -- | |
| Federal National Mortgage Two Galleria Tower | -- | -- | |
| Rankin Thomas | -- | -- | |
| -- | $11,000 | -- |
Source: Public Records
Mortgage History
| Date | Status | Borrower | Loan Amount |
|---|---|---|---|
| Open | Not Available | $22,916 |
Source: Public Records
Tax History Compared to Growth
Tax History
| Year | Tax Paid | Tax Assessment Tax Assessment Total Assessment is a certain percentage of the fair market value that is determined by local assessors to be the total taxable value of land and additions on the property. | Land | Improvement |
|---|---|---|---|---|
| 2025 | $266 | $8,550 | $0 | $0 |
| 2024 | $266 | $8,550 | $2,000 | $6,550 |
| 2023 | $266 | $8,550 | $2,000 | $6,550 |
| 2022 | $266 | $8,550 | $2,000 | $6,550 |
| 2021 | $302 | $6,875 | $2,000 | $4,875 |
| 2020 | $302 | $6,875 | $2,000 | $4,875 |
| 2019 | $302 | $6,875 | $2,000 | $4,875 |
| 2018 | $302 | $6,875 | $2,000 | $4,875 |
| 2017 | $302 | $6,875 | $2,000 | $4,875 |
| 2016 | $302 | $6,875 | $2,000 | $4,875 |
| 2015 | $286 | $6,875 | $2,000 | $4,875 |
| 2014 | $335 | $8,050 | $2,000 | $6,050 |
Source: Public Records
Map
Nearby Homes