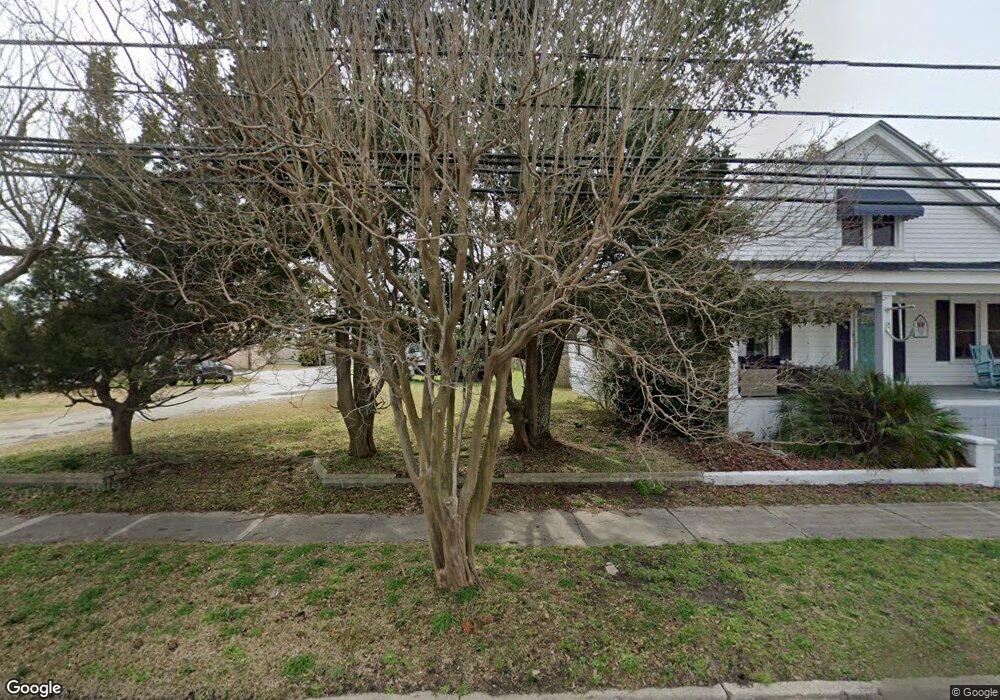
504 Arendell St Morehead City, NC 28557
Estimated Value: $613,360
--
Bed
4
Baths
17,860
Sq Ft
$34/Sq Ft
Est. Value
About This Home
This home is located at 504 Arendell St, Morehead City, NC 28557 and is currently estimated at $613,360, approximately $34 per square foot. 504 Arendell St is a home located in Carteret County with nearby schools including Morehead City Primary School, Morehead Elementary School at Camp Glenn, and Morehead City Middle School.
Ownership History
Date
Name
Owned For
Owner Type
Purchase Details
Closed on
Apr 19, 2017
Sold by
Mountain Estate Llc
Bought by
Rd 1 Investments Llc
Current Estimated Value
Home Financials for this Owner
Home Financials are based on the most recent Mortgage that was taken out on this home.
Original Mortgage
$200,000
Outstanding Balance
$166,430
Interest Rate
4.21%
Mortgage Type
Commercial
Estimated Equity
$446,930
Purchase Details
Closed on
Sep 23, 2015
Sold by
Jones Jonathan Purcell
Bought by
Mountain Escape Llc
Home Financials for this Owner
Home Financials are based on the most recent Mortgage that was taken out on this home.
Original Mortgage
$250,750
Interest Rate
3.93%
Mortgage Type
Commercial
Purchase Details
Closed on
Apr 18, 2011
Sold by
Jones Jonathan Purcell
Bought by
Jones John Purcell
Purchase Details
Closed on
Feb 14, 2011
Sold by
Jones John Purecll
Bought by
Jones Jonathan Purcell and Testamentary Credit Shelter Trust Of Hel
Create a Home Valuation Report for This Property
The Home Valuation Report is an in-depth analysis detailing your home's value as well as a comparison with similar homes in the area
Home Values in the Area
Average Home Value in this Area
Purchase History
| Date | Buyer | Sale Price | Title Company |
|---|---|---|---|
| Rd 1 Investments Llc | $305,000 | None Available | |
| Mountain Escape Llc | $295,000 | Attorney | |
| Jones John Purcell | -- | None Available | |
| Jones Jonathan Purcell | -- | None Available |
Source: Public Records
Mortgage History
| Date | Status | Borrower | Loan Amount |
|---|---|---|---|
| Open | Rd 1 Investments Llc | $200,000 | |
| Previous Owner | Mountain Escape Llc | $250,750 |
Source: Public Records
Tax History Compared to Growth
Tax History
| Year | Tax Paid | Tax Assessment Tax Assessment Total Assessment is a certain percentage of the fair market value that is determined by local assessors to be the total taxable value of land and additions on the property. | Land | Improvement |
|---|---|---|---|---|
| 2025 | $4,350 | $749,244 | $316,300 | $432,944 |
| 2024 | $2,751 | $353,745 | $180,000 | $173,745 |
| 2023 | $1,218 | $353,745 | $180,000 | $173,745 |
| 2022 | $1,182 | $353,745 | $180,000 | $173,745 |
| 2021 | $1,182 | $353,745 | $180,000 | $173,745 |
| 2020 | $1,182 | $353,745 | $180,000 | $173,745 |
| 2019 | $1,378 | $439,747 | $216,000 | $223,747 |
| 2017 | $686 | $216,500 | $0 | $216,500 |
| 2016 | $686 | $216,500 | $0 | $216,500 |
| 2015 | $1,334 | $439,747 | $216,000 | $223,747 |
| 2014 | $1,111 | $365,180 | $177,412 | $187,768 |
Source: Public Records
Map
Nearby Homes
- 504 Arendell St
- 508 Arendell St
- 507 Bridges St
- 101 N 5th St
- 509 Bridges St
- 510 Arendell St
- 104 N 6th St
- 501 Bridges St Unit B
- 501 Bridges St Unit A
- 501 Bridges St
- 501 Bridges St Unit D
- 501 Bridges St Unit C
- 506 Arendell St
- 106 N 6th St
- 512 Arendell St
- 511 Bridges St
- 514 Arendell St
- 410 Arendell St
- 500 Bridges St
- 504 Bridges St