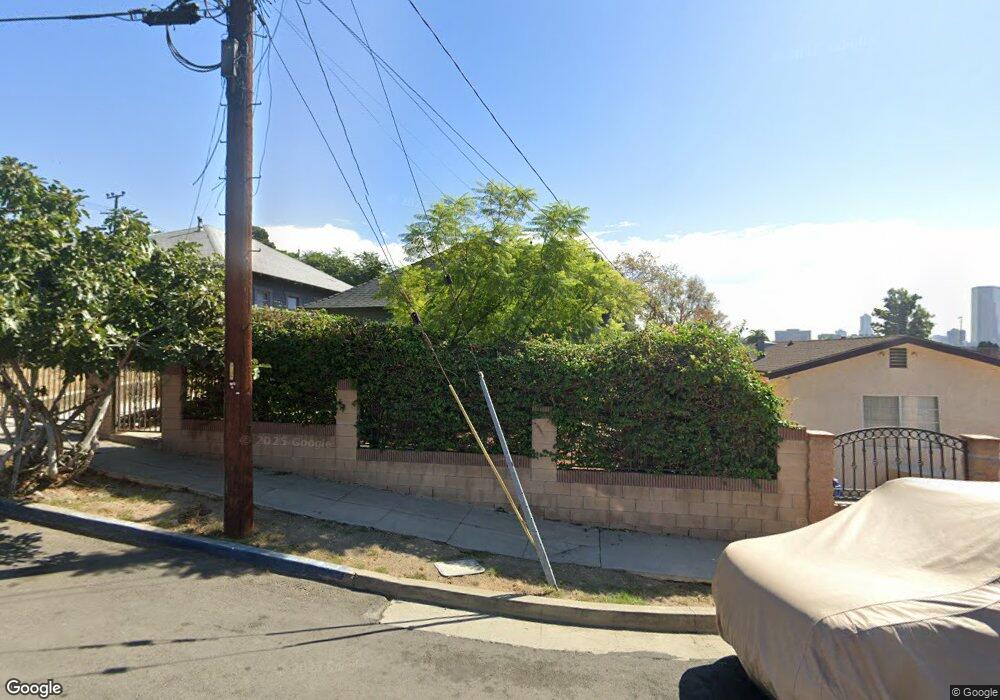
504 N Burlington Ave Los Angeles, CA 90026
Echo Park NeighborhoodEstimated Value: $497,000 - $1,119,000
2
Beds
1
Bath
936
Sq Ft
$882/Sq Ft
Est. Value
About This Home
This home is located at 504 N Burlington Ave, Los Angeles, CA 90026 and is currently estimated at $825,635, approximately $882 per square foot. 504 N Burlington Ave is a home located in Los Angeles County with nearby schools including Virgil Middle School, Belmont High School, and Academic Leadership Community Miguel Contreras Learning Complex.
Ownership History
Date
Name
Owned For
Owner Type
Purchase Details
Closed on
Feb 18, 2020
Sold by
Garibaldi Rocio
Bought by
Cespedes Carlos
Current Estimated Value
Purchase Details
Closed on
Jan 14, 2020
Sold by
Cespedes Leticia
Bought by
Cespedes Carlos
Purchase Details
Closed on
Jan 20, 2015
Sold by
Cespedes Maria Flor
Bought by
Cespedes Maria Flor and Garibaldi Rocio
Purchase Details
Closed on
Sep 4, 2013
Sold by
Cespedes Maria Flor
Bought by
Cespedes Maria Flor and Garibaldi Rocio
Purchase Details
Closed on
Sep 25, 2008
Sold by
Cespedes Jose Fernando
Bought by
Cespedes Jose Fernando
Purchase Details
Closed on
Oct 29, 2004
Sold by
Cespedes Maria Flor
Bought by
Cespedes Maria Flor
Purchase Details
Closed on
Jul 26, 2004
Sold by
Cespedes Jose Fernando
Bought by
Cespedes Jose Fernando
Create a Home Valuation Report for This Property
The Home Valuation Report is an in-depth analysis detailing your home's value as well as a comparison with similar homes in the area
Home Values in the Area
Average Home Value in this Area
Purchase History
| Date | Buyer | Sale Price | Title Company |
|---|---|---|---|
| Cespedes Carlos | $280,000 | Old Republic Title Company | |
| Cespedes Carlos | -- | Old Republic Title Company | |
| Garibaldi Rocio | -- | Old Republic Title Company | |
| Cespedes Maria Flor | -- | None Available | |
| Cespedes Maria Flor | -- | None Available | |
| Cespedes Maria Flor | -- | None Available | |
| Cespedes Jose Fernando | -- | None Available | |
| Cespedes Maria Flor | -- | -- | |
| Cespedes Jose Fernando | -- | None Available |
Source: Public Records
Tax History Compared to Growth
Tax History
| Year | Tax Paid | Tax Assessment Tax Assessment Total Assessment is a certain percentage of the fair market value that is determined by local assessors to be the total taxable value of land and additions on the property. | Land | Improvement |
|---|---|---|---|---|
| 2025 | $5,693 | $462,224 | $370,362 | $91,862 |
| 2024 | $5,693 | $453,161 | $363,100 | $90,061 |
| 2023 | $5,586 | $444,277 | $355,981 | $88,296 |
| 2022 | $5,328 | $435,566 | $349,001 | $86,565 |
| 2021 | $5,263 | $427,026 | $342,158 | $84,868 |
| 2020 | $5,106 | $412,303 | $329,383 | $82,920 |
| 2019 | $567 | $34,667 | $26,785 | $7,882 |
| 2018 | $494 | $33,988 | $26,260 | $7,728 |
| 2016 | $460 | $32,671 | $25,242 | $7,429 |
| 2015 | $454 | $32,181 | $24,863 | $7,318 |
| 2014 | $464 | $31,551 | $24,376 | $7,175 |
Source: Public Records
Map
Nearby Homes
- 1727 Bellevue Ave
- 606 N Bonnie Brae St
- 2005 Bellevue Ave
- 2007 Bellevue Ave
- 1741 Kent St
- 333 N Union Ave
- 616 N Alvarado St
- 334 Belmont Ave
- 1922 Santa Ynez St
- 647 Laveta Terrace
- 251 N Burlington Ave
- 234 N Burlington Ave
- 1120 W Edgeware Rd
- 843 Laveta Terrace
- 1016 Laguna Ave
- 1030 Echo Park Ave
- 2300 Bellevue Ave
- 720 Waterloo St Unit 4
- 901 Rosemont Ave
- 1129 Logan St
- 500 N Burlington Ave
- 508 N Burlington Ave
- 510 N Burlington Ave
- 1712 Bellevue Ave
- 516 N Burlington Ave
- 1720 Bellevue Ave
- 501 Belmont Ave
- 518 N Burlington Ave
- 505 Belmont Ave
- 509 Belmont Ave
- 1706 Bellevue Ave
- 501 N Burlington Ave
- 505 N Burlington Ave
- 511 Belmont Ave
- 509 N Burlington Ave
- 1810 Bellevue Ave
- 601 Belmont Ave
- 1717 Bellevue Ave
- 1717 Bellevue Ave Unit 1719
- 1717 Bellevue Ave