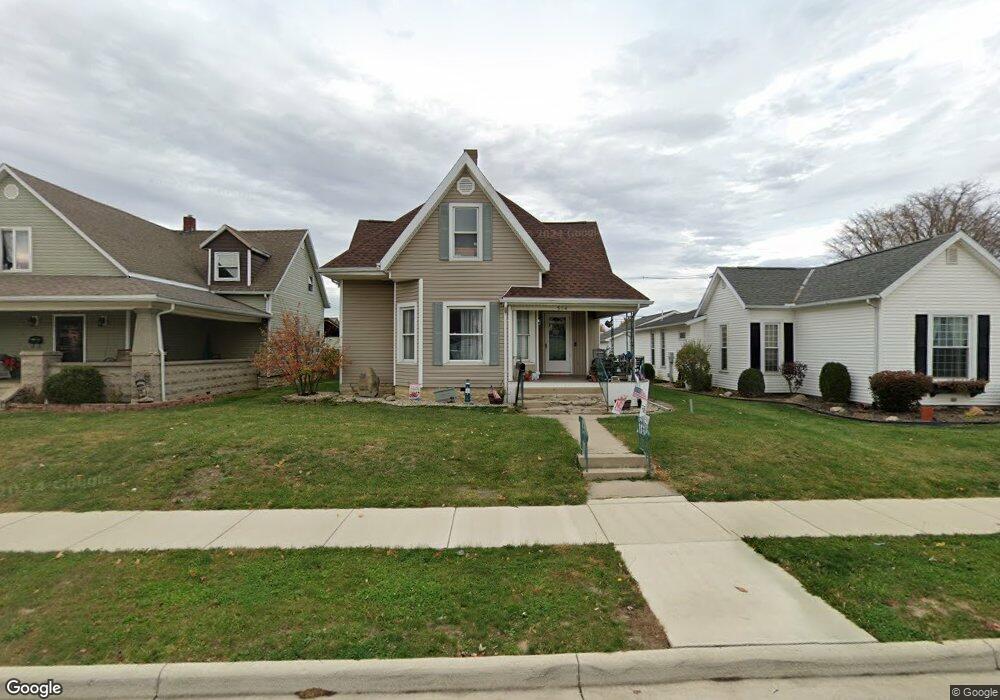
504 W Benton St Wapakoneta, OH 45895
Estimated Value: $204,237 - $256,000
4
Beds
2
Baths
1,982
Sq Ft
$111/Sq Ft
Est. Value
About This Home
This home is located at 504 W Benton St, Wapakoneta, OH 45895 and is currently estimated at $220,809, approximately $111 per square foot. 504 W Benton St is a home located in Auglaize County with nearby schools including Wapakoneta Elementary School, Wapakoneta High School, and Wapakoneta Middle School.
Ownership History
Date
Name
Owned For
Owner Type
Purchase Details
Closed on
Sep 27, 2006
Sold by
Thuman Todd Jay and Thuman Jacqueline M
Bought by
Fleck Tammy R and Fleck Chad A
Current Estimated Value
Home Financials for this Owner
Home Financials are based on the most recent Mortgage that was taken out on this home.
Original Mortgage
$113,050
Outstanding Balance
$77,202
Interest Rate
9.25%
Mortgage Type
Purchase Money Mortgage
Estimated Equity
$143,607
Purchase Details
Closed on
May 10, 1999
Sold by
Bruns Christopher J
Bought by
Thuman Todd Jay
Purchase Details
Closed on
Jun 10, 1991
Sold by
Bruns Leo H
Bought by
Bruns Christopher J
Create a Home Valuation Report for This Property
The Home Valuation Report is an in-depth analysis detailing your home's value as well as a comparison with similar homes in the area
Home Values in the Area
Average Home Value in this Area
Purchase History
| Date | Buyer | Sale Price | Title Company |
|---|---|---|---|
| Fleck Tammy R | $119,000 | Jewel Title Agency | |
| Thuman Todd Jay | $91,000 | -- | |
| Bruns Christopher J | $38,500 | -- |
Source: Public Records
Mortgage History
| Date | Status | Borrower | Loan Amount |
|---|---|---|---|
| Open | Fleck Tammy R | $113,050 |
Source: Public Records
Tax History Compared to Growth
Tax History
| Year | Tax Paid | Tax Assessment Tax Assessment Total Assessment is a certain percentage of the fair market value that is determined by local assessors to be the total taxable value of land and additions on the property. | Land | Improvement |
|---|---|---|---|---|
| 2024 | $2,687 | $55,130 | $7,770 | $47,360 |
| 2023 | $1,800 | $55,130 | $7,770 | $47,360 |
| 2022 | $1,468 | $41,480 | $7,040 | $34,440 |
| 2021 | $1,448 | $41,480 | $7,040 | $34,440 |
| 2020 | $1,452 | $41,483 | $7,039 | $34,444 |
| 2019 | $1,240 | $33,999 | $5,768 | $28,231 |
| 2018 | $1,244 | $33,999 | $5,768 | $28,231 |
| 2017 | $1,238 | $33,999 | $5,768 | $28,231 |
| 2016 | $1,085 | $29,831 | $5,506 | $24,325 |
| 2015 | $1,071 | $29,831 | $5,506 | $24,325 |
| 2014 | $1,082 | $29,831 | $5,506 | $24,325 |
| 2013 | $1,101 | $29,831 | $5,506 | $24,325 |
Source: Public Records
Map
Nearby Homes