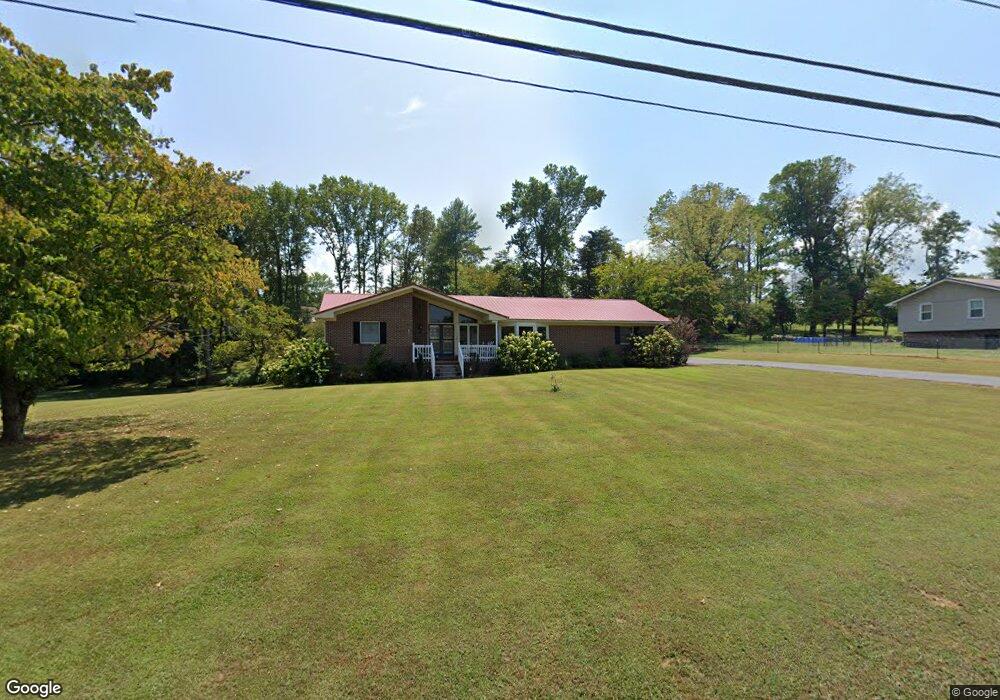
504 Winding Ln Sparta, TN 38583
Estimated Value: $278,024 - $384,000
--
Bed
2
Baths
1,642
Sq Ft
$198/Sq Ft
Est. Value
About This Home
This home is located at 504 Winding Ln, Sparta, TN 38583 and is currently estimated at $324,506, approximately $197 per square foot. 504 Winding Ln is a home located in White County with nearby schools including Woodland Park Elementary School, White County Middle School, and White County High School.
Ownership History
Date
Name
Owned For
Owner Type
Purchase Details
Closed on
Apr 28, 2017
Sold by
Miller Joseph William
Bought by
Miller Thomas E and Miller Starann
Current Estimated Value
Home Financials for this Owner
Home Financials are based on the most recent Mortgage that was taken out on this home.
Original Mortgage
$64,000
Outstanding Balance
$53,224
Interest Rate
4.1%
Mortgage Type
New Conventional
Estimated Equity
$271,282
Purchase Details
Closed on
Mar 17, 2017
Sold by
Miller Thomas Edward T
Bought by
Miller Thomas Edward and Miller Joseph William
Home Financials for this Owner
Home Financials are based on the most recent Mortgage that was taken out on this home.
Original Mortgage
$64,000
Outstanding Balance
$53,224
Interest Rate
4.1%
Mortgage Type
New Conventional
Estimated Equity
$271,282
Purchase Details
Closed on
Sep 8, 2000
Sold by
Herbert Miller
Bought by
Miller Howard B and Miller Agatha T
Purchase Details
Closed on
Oct 1, 1985
Bought by
Miller Herbert and Agatha Miller
Purchase Details
Closed on
Jan 2, 1900
Create a Home Valuation Report for This Property
The Home Valuation Report is an in-depth analysis detailing your home's value as well as a comparison with similar homes in the area
Home Values in the Area
Average Home Value in this Area
Purchase History
| Date | Buyer | Sale Price | Title Company |
|---|---|---|---|
| Miller Thomas E | -- | -- | |
| Miller Thomas Edward | -- | -- | |
| Miller Howard B | -- | -- | |
| Miller Herbert | -- | -- | |
| -- | -- | -- |
Source: Public Records
Mortgage History
| Date | Status | Borrower | Loan Amount |
|---|---|---|---|
| Open | Miller Thomas E | $64,000 |
Source: Public Records
Tax History Compared to Growth
Tax History
| Year | Tax Paid | Tax Assessment Tax Assessment Total Assessment is a certain percentage of the fair market value that is determined by local assessors to be the total taxable value of land and additions on the property. | Land | Improvement |
|---|---|---|---|---|
| 2024 | -- | $45,300 | $8,000 | $37,300 |
| 2023 | $1,345 | $45,300 | $8,000 | $37,300 |
| 2022 | $1,345 | $45,300 | $8,000 | $37,300 |
| 2021 | $1,345 | $45,300 | $8,000 | $37,300 |
| 2020 | $1,345 | $45,300 | $8,000 | $37,300 |
| 2019 | $1,116 | $36,000 | $6,000 | $30,000 |
| 2018 | $1,116 | $36,000 | $6,000 | $30,000 |
| 2017 | $1,116 | $36,000 | $6,000 | $30,000 |
| 2016 | $1,116 | $36,000 | $6,000 | $30,000 |
| 2015 | $1,044 | $36,000 | $6,000 | $30,000 |
| 2014 | -- | $36,000 | $6,000 | $30,000 |
| 2013 | -- | $34,925 | $6,000 | $28,925 |
Source: Public Records
Map
Nearby Homes
- 00 Hickory Valley Rd
- 425 S Young St
- 207 Sugar Hill Dr
- 319 Mountain View Dr
- 319 Mount View Dr
- 231 S Young St
- 136 N Camp Heights Dr
- 214 S South Young St
- 845 McMinnville Hwy
- 0 Knowles St
- 107 Oak St
- 560 Harley's Ridge
- 00 Deer View Dr
- 612 Harleys Ridge
- Lot 3&4 Harbor Green Place
- 403 Gaines St
- 00 Jenna Passons Ln
- 316 Gaines St
- 196 Dairy Barn
- 18 N Church St
- 132 Cumberland St
- 520 Winding Ln
- 503 Winding Ln
- 58 Whispering Pines Dr
- 472 Winding Ln
- 50 Whispering Pines Dr
- 75,76 Cumberland St
- 75 & 76 Cumberland St
- 00 Cumberland St
- lots 75 Cumberland St
- LOT 1 Cumberland St
- 521 Winding Ln
- 150 Cumberland St
- 4762 S Whispering Pines
- 00 Whispering Pines Dr
- LOT 6,8, Whispering Pines Dr
- LOT Whispering Pines Dr
- 79-81-83 Cumberland Valley Way
- LOT 24 Whispering Meadows
- LOT 23 Whispering Meadows