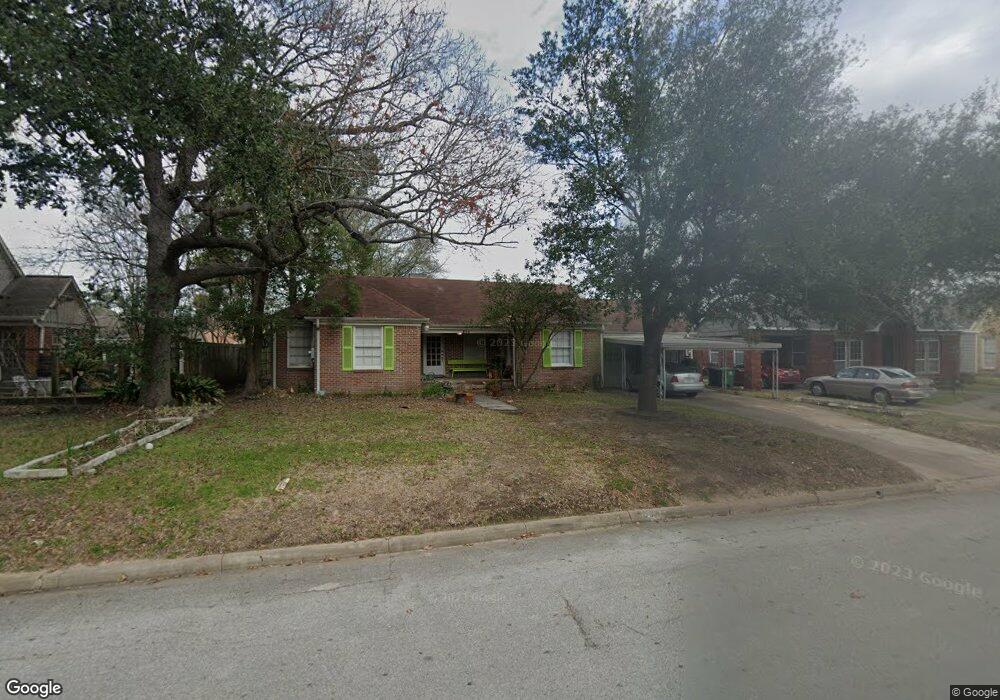
505 Gale St Houston, TX 77009
Northside Village NeighborhoodEstimated Value: $372,230 - $475,000
4
Beds
5
Baths
3,997
Sq Ft
$108/Sq Ft
Est. Value
About This Home
This home is located at 505 Gale St, Houston, TX 77009 and is currently estimated at $430,808, approximately $107 per square foot. 505 Gale St is a home located in Harris County with nearby schools including Jefferson Elementary School, Marshall Middle, and Northside High School.
Ownership History
Date
Name
Owned For
Owner Type
Purchase Details
Closed on
Jul 28, 2009
Sold by
Tuck Nancy
Bought by
Camp Samuel
Current Estimated Value
Home Financials for this Owner
Home Financials are based on the most recent Mortgage that was taken out on this home.
Original Mortgage
$136,000
Outstanding Balance
$89,707
Interest Rate
5.44%
Mortgage Type
Purchase Money Mortgage
Estimated Equity
$341,101
Purchase Details
Closed on
Feb 2, 2007
Sold by
Casey Shirley Whiston Kendrick
Bought by
Tuck Nancy
Purchase Details
Closed on
Sep 30, 1994
Sold by
Lofti Michael M
Bought by
Casey Shirley W
Home Financials for this Owner
Home Financials are based on the most recent Mortgage that was taken out on this home.
Original Mortgage
$66,500
Interest Rate
8.5%
Create a Home Valuation Report for This Property
The Home Valuation Report is an in-depth analysis detailing your home's value as well as a comparison with similar homes in the area
Home Values in the Area
Average Home Value in this Area
Purchase History
| Date | Buyer | Sale Price | Title Company |
|---|---|---|---|
| Camp Samuel | -- | Fidelity National Title | |
| Tuck Nancy | -- | None Available | |
| Casey Shirley W | -- | -- |
Source: Public Records
Mortgage History
| Date | Status | Borrower | Loan Amount |
|---|---|---|---|
| Open | Camp Samuel | $136,000 | |
| Previous Owner | Casey Shirley W | $66,500 |
Source: Public Records
Tax History Compared to Growth
Tax History
| Year | Tax Paid | Tax Assessment Tax Assessment Total Assessment is a certain percentage of the fair market value that is determined by local assessors to be the total taxable value of land and additions on the property. | Land | Improvement |
|---|---|---|---|---|
| 2025 | $7,467 | $356,848 | $216,913 | $139,935 |
| 2024 | $7,467 | $356,848 | $216,913 | $139,935 |
| 2023 | $7,467 | $374,717 | $216,913 | $157,804 |
| 2022 | $6,715 | $333,658 | $194,250 | $139,408 |
| 2021 | $6,462 | $277,259 | $148,925 | $128,334 |
| 2020 | $6,218 | $256,787 | $148,925 | $107,862 |
| 2019 | $6,208 | $248,806 | $148,925 | $99,881 |
| 2018 | $4,235 | $223,015 | $148,925 | $74,090 |
| 2017 | $5,554 | $223,015 | $148,925 | $74,090 |
| 2016 | $5,049 | $223,808 | $166,950 | $56,858 |
| 2015 | $3,232 | $203,218 | $111,300 | $91,918 |
| 2014 | $3,232 | $165,019 | $103,350 | $61,669 |
Source: Public Records
Map
Nearby Homes