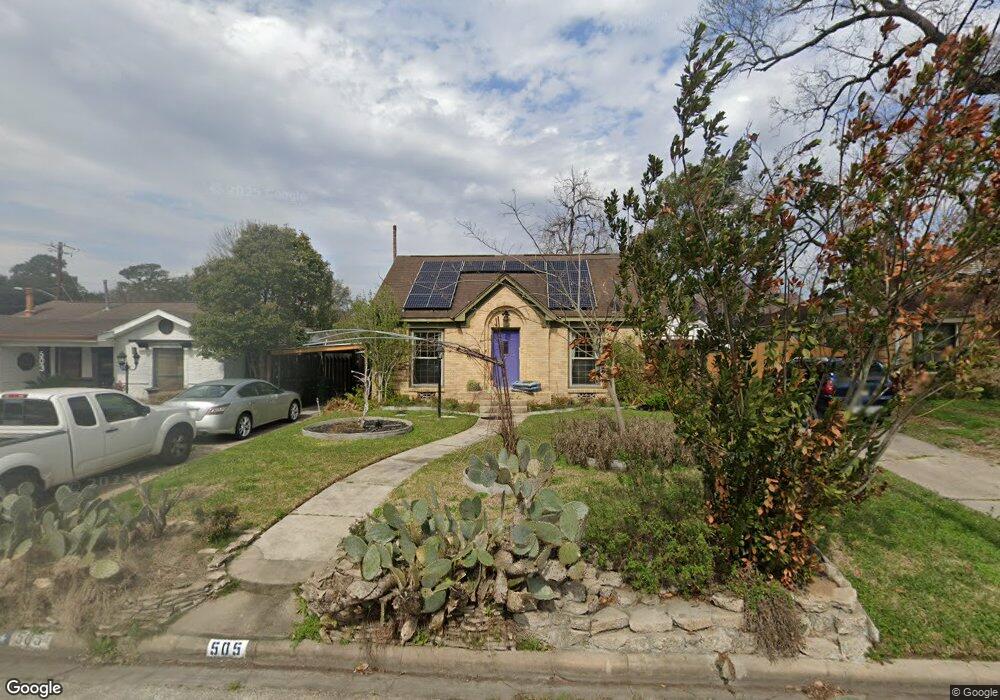
505 Joyce St Houston, TX 77009
Northside Village NeighborhoodEstimated Value: $344,330 - $428,000
3
Beds
2
Baths
1,447
Sq Ft
$261/Sq Ft
Est. Value
About This Home
This home is located at 505 Joyce St, Houston, TX 77009 and is currently estimated at $377,583, approximately $260 per square foot. 505 Joyce St is a home located in Harris County with nearby schools including Jefferson Elementary School, Marshall Middle, and Northside High School.
Ownership History
Date
Name
Owned For
Owner Type
Purchase Details
Closed on
Jan 27, 2006
Sold by
Garcia Mark A
Bought by
Martinec Erik
Current Estimated Value
Home Financials for this Owner
Home Financials are based on the most recent Mortgage that was taken out on this home.
Original Mortgage
$145,000
Outstanding Balance
$80,162
Interest Rate
6.09%
Mortgage Type
Fannie Mae Freddie Mac
Estimated Equity
$297,421
Purchase Details
Closed on
May 28, 1998
Sold by
Pimlott Allison D and Brown Preston C
Bought by
Garcia Mark A
Home Financials for this Owner
Home Financials are based on the most recent Mortgage that was taken out on this home.
Original Mortgage
$78,375
Interest Rate
7.2%
Create a Home Valuation Report for This Property
The Home Valuation Report is an in-depth analysis detailing your home's value as well as a comparison with similar homes in the area
Home Values in the Area
Average Home Value in this Area
Purchase History
| Date | Buyer | Sale Price | Title Company |
|---|---|---|---|
| Martinec Erik | -- | Partners Title Company | |
| Garcia Mark A | -- | -- |
Source: Public Records
Mortgage History
| Date | Status | Borrower | Loan Amount |
|---|---|---|---|
| Open | Martinec Erik | $145,000 | |
| Previous Owner | Garcia Mark A | $78,375 |
Source: Public Records
Tax History Compared to Growth
Tax History
| Year | Tax Paid | Tax Assessment Tax Assessment Total Assessment is a certain percentage of the fair market value that is determined by local assessors to be the total taxable value of land and additions on the property. | Land | Improvement |
|---|---|---|---|---|
| 2025 | $1,064 | $315,521 | $172,525 | $142,996 |
| 2024 | $1,064 | $316,466 | $172,525 | $143,941 |
| 2023 | $1,064 | $332,204 | $172,525 | $159,679 |
| 2022 | $6,160 | $299,683 | $154,500 | $145,183 |
| 2021 | $5,928 | $254,336 | $118,450 | $135,886 |
| 2020 | $5,749 | $237,404 | $118,450 | $118,954 |
| 2019 | $5,040 | $202,437 | $118,450 | $83,987 |
| 2018 | $3,382 | $181,076 | $118,450 | $62,626 |
| 2017 | $4,579 | $181,076 | $118,450 | $62,626 |
| 2016 | $4,398 | $196,111 | $148,029 | $48,082 |
| 2015 | $2,792 | $175,856 | $98,686 | $77,170 |
| 2014 | $2,792 | $143,732 | $91,637 | $52,095 |
Source: Public Records
Map
Nearby Homes