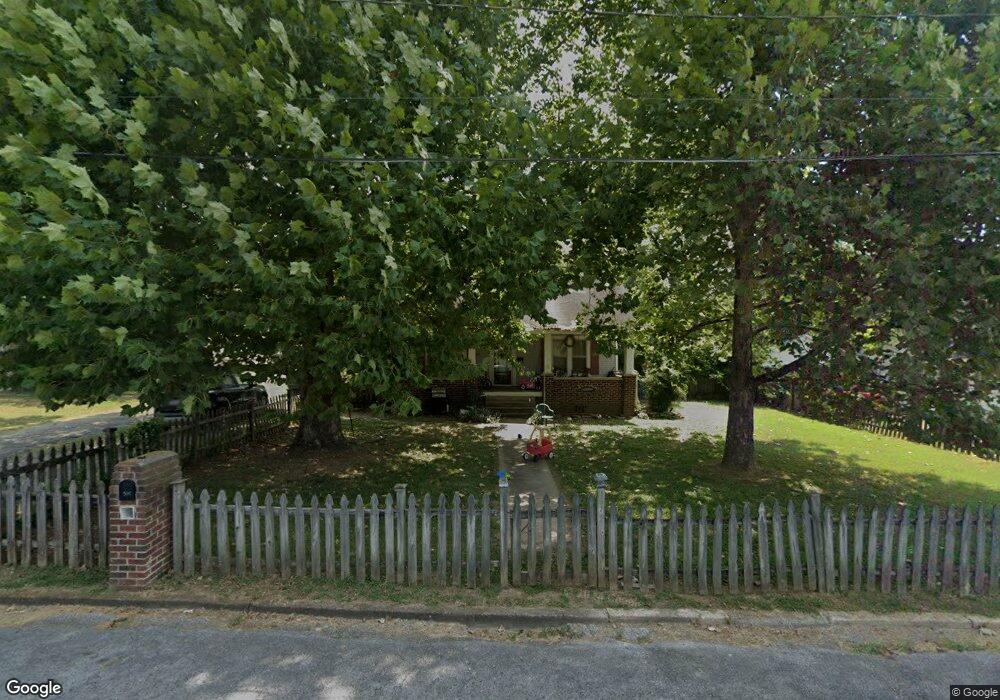
505 Lee Ave Fayetteville, TN 37334
Estimated Value: $191,000 - $235,000
--
Bed
1
Bath
1,601
Sq Ft
$132/Sq Ft
Est. Value
About This Home
This home is located at 505 Lee Ave, Fayetteville, TN 37334 and is currently estimated at $210,764, approximately $131 per square foot. 505 Lee Ave is a home located in Lincoln County with nearby schools including Ralph Askins School, Fayetteville High School, and Riverside Christian Academy.
Ownership History
Date
Name
Owned For
Owner Type
Purchase Details
Closed on
May 20, 2011
Sold by
Rutlege Brian T
Bought by
Rutlege Angel R
Current Estimated Value
Purchase Details
Closed on
Apr 3, 2000
Sold by
Grant David B
Bought by
Rutledge Brian T and Rutledge Angel
Purchase Details
Closed on
Jul 15, 1997
Sold by
Fletcher John C
Bought by
Grant David and Grant Carol
Home Financials for this Owner
Home Financials are based on the most recent Mortgage that was taken out on this home.
Original Mortgage
$57,000
Interest Rate
7.7%
Purchase Details
Closed on
Feb 26, 1993
Bought by
Fletcher John C and Fletcher Susan
Purchase Details
Closed on
Jun 15, 1990
Bought by
Mcalister Faye
Purchase Details
Closed on
Aug 27, 1935
Bought by
Bailey Frank and Bailey Annie
Create a Home Valuation Report for This Property
The Home Valuation Report is an in-depth analysis detailing your home's value as well as a comparison with similar homes in the area
Home Values in the Area
Average Home Value in this Area
Purchase History
| Date | Buyer | Sale Price | Title Company |
|---|---|---|---|
| Rutlege Angel R | -- | -- | |
| Rutlege Angel R | -- | -- | |
| Rutledge Brian T | $70,000 | -- | |
| Rutledge Brian T | $70,000 | -- | |
| Grant David | $60,000 | -- | |
| Grant David | $60,000 | -- | |
| Fletcher John C | $46,800 | -- | |
| Fletcher John C | $46,800 | -- | |
| Mcalister Faye | $35,000 | -- | |
| Mcalister Faye | $35,000 | -- | |
| Bailey Frank | -- | -- | |
| Bailey Frank | -- | -- |
Source: Public Records
Mortgage History
| Date | Status | Borrower | Loan Amount |
|---|---|---|---|
| Previous Owner | Bailey Frank | $57,000 |
Source: Public Records
Tax History Compared to Growth
Tax History
| Year | Tax Paid | Tax Assessment Tax Assessment Total Assessment is a certain percentage of the fair market value that is determined by local assessors to be the total taxable value of land and additions on the property. | Land | Improvement |
|---|---|---|---|---|
| 2024 | -- | $37,350 | $8,400 | $28,950 |
| 2023 | $643 | $22,325 | $3,525 | $18,800 |
| 2022 | $469 | $22,325 | $3,525 | $18,800 |
| 2021 | $469 | $22,325 | $3,525 | $18,800 |
| 2020 | $795 | $22,075 | $3,525 | $18,550 |
| 2019 | $795 | $22,075 | $3,525 | $18,550 |
| 2018 | $716 | $17,325 | $2,500 | $14,825 |
| 2017 | $691 | $17,325 | $2,500 | $14,825 |
| 2016 | $691 | $17,325 | $2,500 | $14,825 |
| 2015 | $625 | $17,325 | $2,500 | $14,825 |
| 2014 | $625 | $17,325 | $2,500 | $14,825 |
Source: Public Records
Map
Nearby Homes
- 206 Bright Ave
- 204 Bright Ave
- 508 Lincoln Ave N
- 512 Main Ave N
- 214 Washington St W
- 0 Edison St W
- 206 Edison St W
- 306 Magnolia Ave
- 703 Hatcher Dr
- 710 Hatcher Dr
- 1002 College St W
- 406 Market St W
- 414 Cherokee Ave
- 600 Cherokee Ave
- 207 Campbell St W
- 609 Cherokee Ave
- 404 Washington St E
- 405 Hedgemont Ave
- 801 2nd Ave
- 405 Calhoun Ave