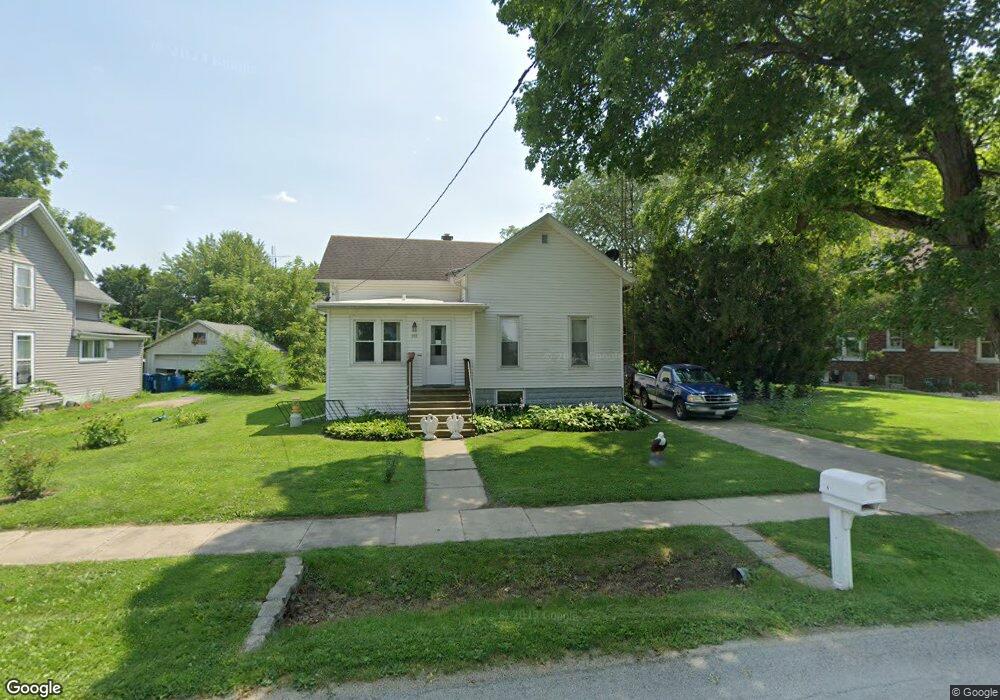
505 North St Earlville, IL 60518
Estimated Value: $151,812 - $192,000
--
Bed
--
Bath
1,380
Sq Ft
$122/Sq Ft
Est. Value
About This Home
This home is located at 505 North St, Earlville, IL 60518 and is currently estimated at $168,703, approximately $122 per square foot. 505 North St is a home located in LaSalle County with nearby schools including Earlville Elementary School and Earlville Junior/Senior High School.
Ownership History
Date
Name
Owned For
Owner Type
Purchase Details
Closed on
Mar 28, 2023
Sold by
Morton Donna J
Bought by
Krolik Gary John Paul
Current Estimated Value
Home Financials for this Owner
Home Financials are based on the most recent Mortgage that was taken out on this home.
Original Mortgage
$65,000
Outstanding Balance
$63,099
Interest Rate
6.32%
Mortgage Type
New Conventional
Estimated Equity
$105,604
Purchase Details
Closed on
Oct 7, 2015
Sold by
Morton John A and Morton Pamela S
Bought by
Morton John E and Morton Donna J
Create a Home Valuation Report for This Property
The Home Valuation Report is an in-depth analysis detailing your home's value as well as a comparison with similar homes in the area
Home Values in the Area
Average Home Value in this Area
Purchase History
| Date | Buyer | Sale Price | Title Company |
|---|---|---|---|
| Krolik Gary John Paul | $60,000 | None Available | |
| Morton John E | -- | -- |
Source: Public Records
Mortgage History
| Date | Status | Borrower | Loan Amount |
|---|---|---|---|
| Open | Krolik Gary John Paul | $65,000 |
Source: Public Records
Tax History Compared to Growth
Tax History
| Year | Tax Paid | Tax Assessment Tax Assessment Total Assessment is a certain percentage of the fair market value that is determined by local assessors to be the total taxable value of land and additions on the property. | Land | Improvement |
|---|---|---|---|---|
| 2024 | $3,061 | $42,511 | $2,954 | $39,557 |
| 2023 | $2,743 | $37,550 | $2,609 | $34,941 |
| 2022 | $2,059 | $33,668 | $5,288 | $28,380 |
| 2021 | $2,085 | $33,093 | $5,198 | $27,895 |
| 2020 | $1,152 | $32,101 | $5,042 | $27,059 |
| 2019 | $1,180 | $30,713 | $4,824 | $25,889 |
| 2018 | $1,204 | $27,197 | $4,639 | $22,558 |
| 2017 | $1,236 | $24,822 | $4,234 | $20,588 |
| 2016 | $1,267 | $23,198 | $3,957 | $19,241 |
| 2015 | $2,328 | $22,226 | $3,791 | $18,435 |
| 2012 | -- | $26,115 | $4,454 | $21,661 |
Source: Public Records
Map
Nearby Homes