
Seller's Agent in 2025
James Nolen
Nest Realty SWVA
(540) 553-5742
3 in this area
34 Total Sales
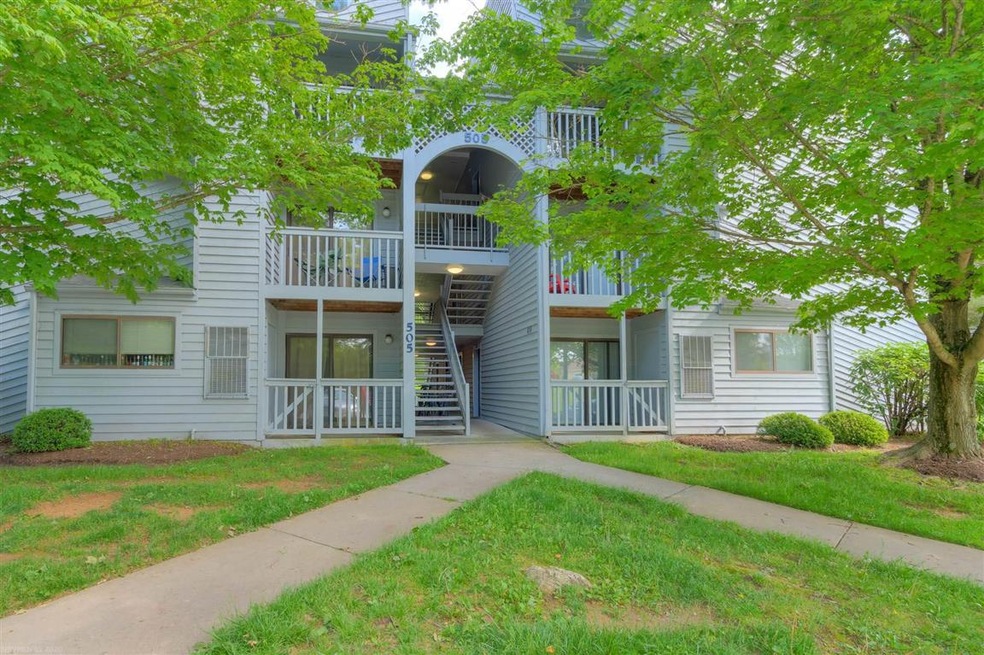
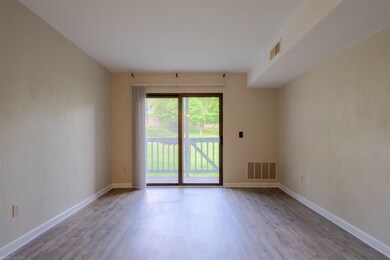
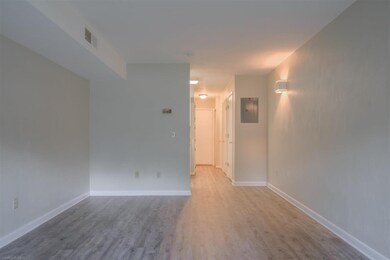
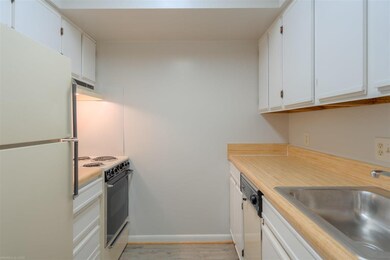
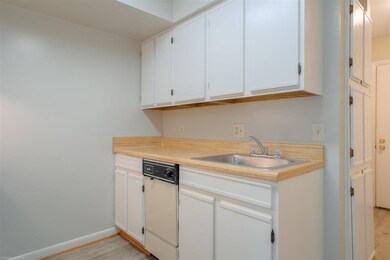
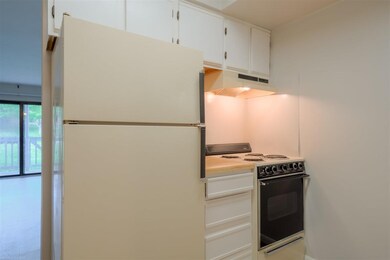
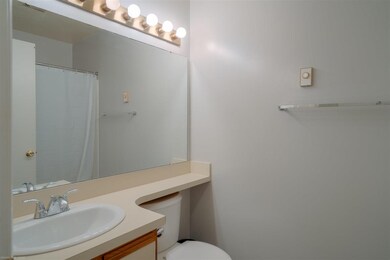
Great buy on an efficiency unit located on the first floor. Unit C. All on one level with a full bath, and fully equipped kitchen. No steps! Washer/dryer in the unit. Association dues covers water/sewer and trash. Condo is located on Blacksburg Transit bus route. Excellent location! Close to VA Tech, shopping, dining, and schools.
Last Agent to Sell the Property
RE/MAX 8 - Blacksburg License #225185609 Listed on: 05/25/2020
Home Type
Est. Annual Taxes
Year Built
Parking
Home Design
Kitchen
Flooring
Utilities
Additional Features
Community Details
Listing and Financial Details
| Date | Type | Sale Price | Title Company |
|---|---|---|---|
| Deed | -- | -- |
| Date | Status | Loan Amount | Loan Type |
|---|---|---|---|
| Open | $445,000 | Credit Line Revolving |
| Date | Event | Price | Change | Sq Ft Price |
|---|---|---|---|---|
| 06/20/2025 06/20/25 | Sold | $155,000 | +3.4% | $359 / Sq Ft |
| 06/11/2025 06/11/25 | Pending | -- | -- | -- |
| 06/10/2025 06/10/25 | For Sale | $149,900 | -14.3% | $347 / Sq Ft |
| 02/07/2025 02/07/25 | Sold | $175,000 | +6.1% | $304 / Sq Ft |
| 01/26/2025 01/26/25 | Pending | -- | -- | -- |
| 01/23/2025 01/23/25 | For Sale | $165,000 | -5.2% | $286 / Sq Ft |
| 11/17/2023 11/17/23 | Sold | $174,000 | +2.4% | $237 / Sq Ft |
| 10/25/2023 10/25/23 | Pending | -- | -- | -- |
| 10/19/2023 10/19/23 | For Sale | $169,900 | -15.0% | $232 / Sq Ft |
| 08/18/2022 08/18/22 | Sold | $199,900 | 0.0% | $179 / Sq Ft |
| 07/08/2022 07/08/22 | Pending | -- | -- | -- |
| 07/06/2022 07/06/22 | For Sale | $199,900 | -5.3% | $179 / Sq Ft |
| 03/11/2022 03/11/22 | Sold | $211,000 | +18.2% | $275 / Sq Ft |
| 02/15/2022 02/15/22 | Pending | -- | -- | -- |
| 02/11/2022 02/11/22 | For Sale | $178,500 | -11.0% | $232 / Sq Ft |
| 03/24/2021 03/24/21 | Sold | $200,500 | +2.8% | $183 / Sq Ft |
| 12/26/2020 12/26/20 | Pending | -- | -- | -- |
| 12/21/2020 12/21/20 | For Sale | $195,000 | +116.9% | $178 / Sq Ft |
| 06/25/2020 06/25/20 | Sold | $89,900 | 0.0% | $208 / Sq Ft |
| 05/26/2020 05/26/20 | Pending | -- | -- | -- |
| 05/25/2020 05/25/20 | For Sale | $89,900 | -23.8% | $208 / Sq Ft |
| 08/02/2019 08/02/19 | Sold | $118,000 | -1.7% | $154 / Sq Ft |
| 07/17/2019 07/17/19 | Pending | -- | -- | -- |
| 06/26/2019 06/26/19 | For Sale | $120,000 | -21.1% | $156 / Sq Ft |
| 04/15/2019 04/15/19 | Sold | $152,000 | +2.0% | $140 / Sq Ft |
| 03/11/2019 03/11/19 | Pending | -- | -- | -- |
| 03/08/2019 03/08/19 | For Sale | $149,000 | +34.2% | $137 / Sq Ft |
| 12/27/2018 12/27/18 | Sold | $111,000 | -2.6% | $193 / Sq Ft |
| 12/27/2018 12/27/18 | Pending | -- | -- | -- |
| 12/27/2018 12/27/18 | For Sale | $114,000 | -23.5% | $198 / Sq Ft |
| 10/14/2018 10/14/18 | For Sale | $149,000 | 0.0% | $134 / Sq Ft |
| 02/28/2018 02/28/18 | Sold | $149,000 | +92.3% | $134 / Sq Ft |
| 02/16/2018 02/16/18 | Sold | $77,500 | -20.9% | $179 / Sq Ft |
| 01/30/2018 01/30/18 | Pending | -- | -- | -- |
| 01/22/2018 01/22/18 | For Sale | $98,000 | +34.2% | $227 / Sq Ft |
| 01/11/2018 01/11/18 | Pending | -- | -- | -- |
| 05/25/2017 05/25/17 | Sold | $73,000 | -18.8% | $169 / Sq Ft |
| 05/09/2017 05/09/17 | Pending | -- | -- | -- |
| 05/05/2017 05/05/17 | For Sale | $89,900 | +45.0% | $208 / Sq Ft |
| 12/05/2016 12/05/16 | Sold | $62,000 | 0.0% | $144 / Sq Ft |
| 11/14/2016 11/14/16 | Pending | -- | -- | -- |
| 11/12/2016 11/12/16 | For Sale | $62,000 | -44.1% | $144 / Sq Ft |
| 10/31/2013 10/31/13 | Sold | $111,000 | -5.1% | $99 / Sq Ft |
| 10/04/2013 10/04/13 | Pending | -- | -- | -- |
| 09/03/2013 09/03/13 | For Sale | $117,000 | -- | $105 / Sq Ft |
| Year | Tax Paid | Tax Assessment Tax Assessment Total Assessment is a certain percentage of the fair market value that is determined by local assessors to be the total taxable value of land and additions on the property. | Land | Improvement |
|---|---|---|---|---|
| 2024 | $1,184 | $157,800 | $0 | $157,800 |
| 2023 | $1,105 | $157,800 | $0 | $157,800 |
| 2022 | $941 | $105,700 | $0 | $105,700 |
| 2021 | $941 | $105,700 | $0 | $105,700 |
| 2020 | $941 | $105,700 | $0 | $105,700 |
| 2019 | $941 | $105,700 | $0 | $105,700 |
| 2018 | $893 | $100,300 | $0 | $100,300 |
| 2017 | $893 | $100,300 | $0 | $100,300 |
| 2016 | $893 | $100,300 | $0 | $100,300 |
| 2015 | $893 | $100,300 | $0 | $100,300 |
| 2014 | $915 | $102,800 | $0 | $102,800 |
Seller's Agent in 2025
James Nolen
Nest Realty SWVA
(540) 553-5742
3 in this area
34 Total Sales
Seller's Agent in 2025
Tommy Clapp
Coldwell Banker Townside Bburg
(540) 320-6732
2 in this area
72 Total Sales
Buyer's Agent in 2025
David Phillips
Phillips Real Estate
(540) 250-6730
8 in this area
171 Total Sales
L
Buyer's Agent in 2025
Laura Kelley
Berkshire Hathaway Home Services Mountain Sky Properties-Blacksburg
(540) 641-8188
1 in this area
15 Total Sales
Seller's Agent in 2023
Ryan McCollum
Long & Foster - Blacksburg
(540) 449-9733
3 in this area
129 Total Sales
Buyer's Agent in 2023
Marshall Anderson
Long & Foster - Blacksburg
(540) 320-7653
1 in this area
115 Total Sales
Source: New River Valley Association of REALTORS®
MLS Number: 408798
APN: 028782
Disclaimer: Certain information contained herein is derived from information provided by parties other than Homes.com. All information provided is deemed reliable, but is not guaranteed to be accurate and should be independently verified.
![]() IDX information is provided exclusively for personal, non-commercial use, and may not be used for any purpose other than to identify prospective properties consumers may be interested in purchasing. Information is deemed reliable but not guaranteed.
IDX information is provided exclusively for personal, non-commercial use, and may not be used for any purpose other than to identify prospective properties consumers may be interested in purchasing. Information is deemed reliable but not guaranteed.