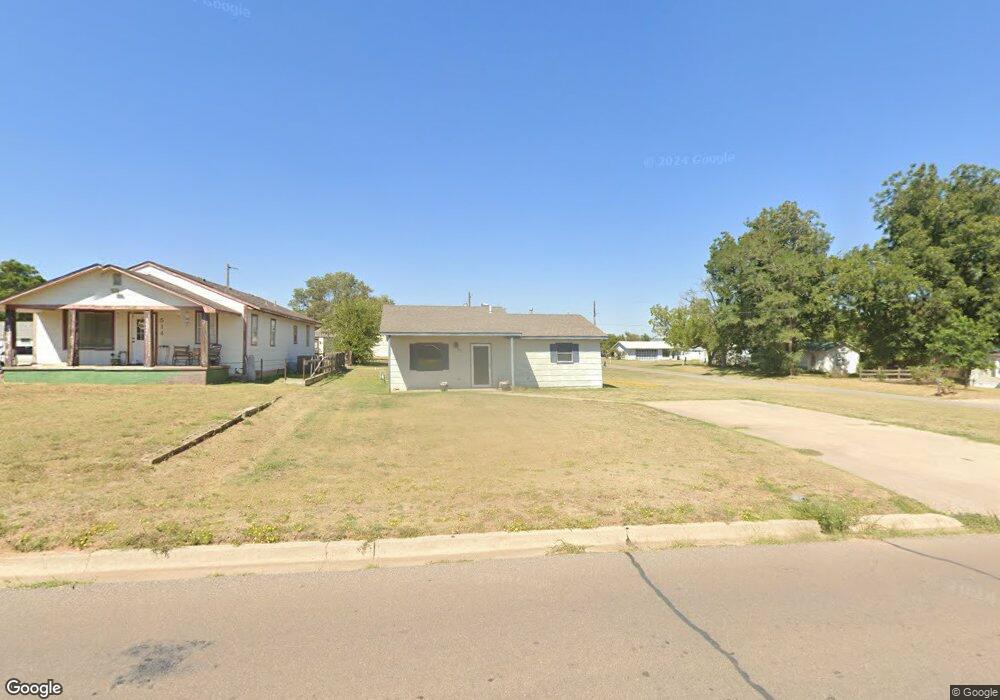
506 Madison Ave Woodward, OK 73801
Estimated Value: $68,000 - $85,000
2
Beds
1
Bath
816
Sq Ft
$92/Sq Ft
Est. Value
About This Home
This home is located at 506 Madison Ave, Woodward, OK 73801 and is currently estimated at $75,088, approximately $92 per square foot. 506 Madison Ave is a home located in Woodward County with nearby schools including Woodward High School and Woodward Christian Academy.
Ownership History
Date
Name
Owned For
Owner Type
Purchase Details
Closed on
Apr 2, 2019
Sold by
Harris Roger and Harris Lena
Bought by
Harris Rory
Current Estimated Value
Purchase Details
Closed on
Dec 21, 2007
Sold by
Snider Kenneth L and Snider Alberta M
Bought by
Snider Shirley Jean
Home Financials for this Owner
Home Financials are based on the most recent Mortgage that was taken out on this home.
Original Mortgage
$30,500
Outstanding Balance
$21,410
Interest Rate
6.26%
Mortgage Type
USDA
Estimated Equity
$53,678
Purchase Details
Closed on
May 12, 2005
Sold by
Snider Kenneth W
Bought by
Snider Kenneth L and Snider Alberta M
Home Financials for this Owner
Home Financials are based on the most recent Mortgage that was taken out on this home.
Original Mortgage
$19,800
Interest Rate
6.03%
Mortgage Type
Future Advance Clause Open End Mortgage
Purchase Details
Closed on
May 16, 2002
Bought by
Snider Kenneth W and Snider Beth D
Create a Home Valuation Report for This Property
The Home Valuation Report is an in-depth analysis detailing your home's value as well as a comparison with similar homes in the area
Home Values in the Area
Average Home Value in this Area
Purchase History
| Date | Buyer | Sale Price | Title Company |
|---|---|---|---|
| Harris Rory | -- | None Available | |
| Harris Roger | -- | None Available | |
| Snider Shirley Jean | $28,000 | -- | |
| Snider Kenneth L | $22,000 | -- | |
| Snider Kenneth W | $20,000 | -- |
Source: Public Records
Mortgage History
| Date | Status | Borrower | Loan Amount |
|---|---|---|---|
| Open | Snider Shirley Jean | $30,500 | |
| Previous Owner | Snider Kenneth L | $19,800 |
Source: Public Records
Tax History Compared to Growth
Tax History
| Year | Tax Paid | Tax Assessment Tax Assessment Total Assessment is a certain percentage of the fair market value that is determined by local assessors to be the total taxable value of land and additions on the property. | Land | Improvement |
|---|---|---|---|---|
| 2023 | $423 | $4,643 | $850 | $3,793 |
| 2022 | $411 | $4,422 | $811 | $3,611 |
| 2021 | $380 | $4,211 | $766 | $3,445 |
| 2020 | $365 | $4,011 | $718 | $3,293 |
| 2019 | $341 | $3,820 | $673 | $3,147 |
| 2018 | $330 | $3,638 | $655 | $2,983 |
| 2017 | $311 | $3,465 | $640 | $2,825 |
| 2016 | $300 | $3,301 | $1,025 | $2,276 |
| 2015 | $193 | $2,211 | $687 | $1,524 |
| 2014 | $190 | $3,172 | $832 | $2,340 |
Source: Public Records
Map
Nearby Homes
- 608 7th St
- 602 Jefferson St
- 806 9th St Unit 810 Webster
- 802 Main St
- 1001 10th St
- 915a Main St
- 220 & 222 E Santa fe Ave
- 1007 Main St
- 1009 Main St
- 1023 Main St
- 603 Oklahoma Ave Unit 607 Oklahoma Ave, 61
- 1107 Main St
- 221 14th St
- 1208 Oklahoma Ave
- 1402 Main St
- 1521 6th St
- 1618 9th St
- 1621 8th St
- 1620 9th St
- 1428 Oklahoma Ave