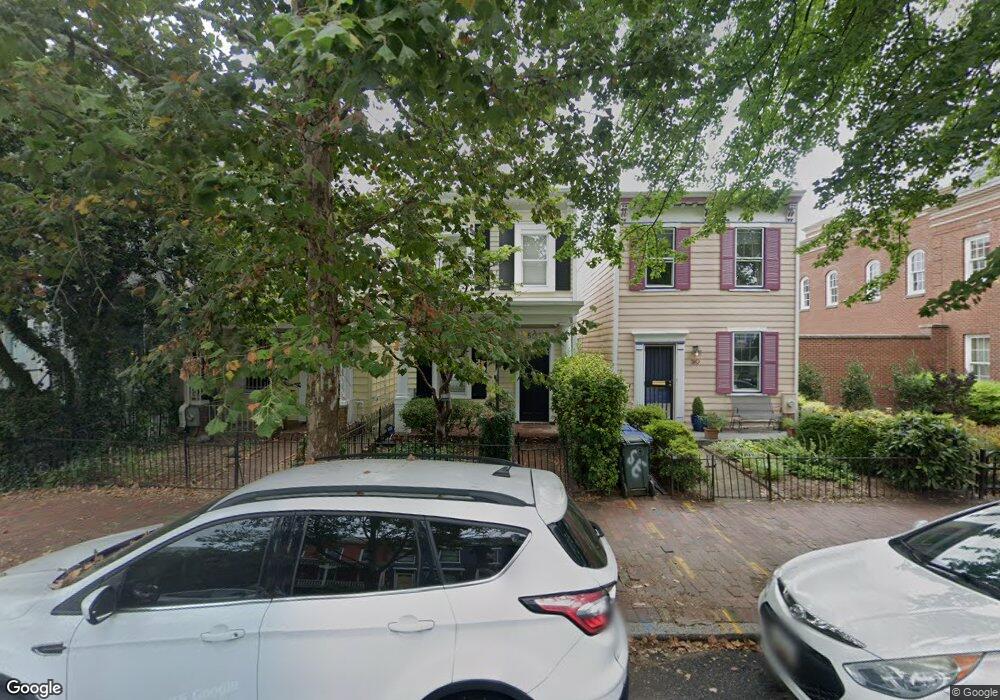
508 7th St SE Washington, DC 20003
Capitol Hill NeighborhoodEstimated Value: $1,010,484 - $1,132,000
2
Beds
2
Baths
1,260
Sq Ft
$846/Sq Ft
Est. Value
About This Home
This home is located at 508 7th St SE, Washington, DC 20003 and is currently estimated at $1,065,371, approximately $845 per square foot. 508 7th St SE is a home located in District of Columbia with nearby schools including John Tyler Elementary School, Jefferson Middle School Academy, and Eastern High School.
Ownership History
Date
Name
Owned For
Owner Type
Purchase Details
Closed on
Sep 16, 2020
Sold by
Flowers Benjamin H and Flowers Mary Miller
Bought by
Flowers Benjamin and Flowers Mary Miller
Current Estimated Value
Purchase Details
Closed on
Sep 5, 2014
Sold by
Flowers Benjamin H and Flowers Richard L
Bought by
Flowers Benjamin H and Flowers Mary M
Home Financials for this Owner
Home Financials are based on the most recent Mortgage that was taken out on this home.
Original Mortgage
$38,000
Outstanding Balance
$29,007
Interest Rate
4.14%
Mortgage Type
Construction
Estimated Equity
$1,036,364
Purchase Details
Closed on
Mar 31, 2009
Sold by
Kingston Amy
Bought by
Flowers Benjamin and Miller,Carol
Home Financials for this Owner
Home Financials are based on the most recent Mortgage that was taken out on this home.
Original Mortgage
$559,675
Interest Rate
4.92%
Mortgage Type
FHA
Create a Home Valuation Report for This Property
The Home Valuation Report is an in-depth analysis detailing your home's value as well as a comparison with similar homes in the area
Home Values in the Area
Average Home Value in this Area
Purchase History
| Date | Buyer | Sale Price | Title Company |
|---|---|---|---|
| Flowers Benjamin | -- | None Available | |
| Flowers Benjamin H | -- | -- | |
| Flowers Benjamin | $570,000 | -- |
Source: Public Records
Mortgage History
| Date | Status | Borrower | Loan Amount |
|---|---|---|---|
| Open | Flowers Benjamin H | $38,000 | |
| Previous Owner | Flowers Benjamin | $559,675 |
Source: Public Records
Tax History Compared to Growth
Tax History
| Year | Tax Paid | Tax Assessment Tax Assessment Total Assessment is a certain percentage of the fair market value that is determined by local assessors to be the total taxable value of land and additions on the property. | Land | Improvement |
|---|---|---|---|---|
| 2025 | $7,520 | $974,580 | $584,870 | $389,710 |
| 2024 | $7,451 | $963,630 | $581,950 | $381,680 |
| 2023 | $7,159 | $926,200 | $560,220 | $365,980 |
| 2022 | $6,726 | $869,940 | $525,220 | $344,720 |
| 2021 | $6,494 | $840,340 | $514,820 | $325,520 |
| 2020 | $6,338 | $821,300 | $497,840 | $323,460 |
| 2019 | $6,023 | $783,420 | $468,020 | $315,400 |
| 2018 | $5,848 | $761,370 | $0 | $0 |
| 2017 | $5,830 | $758,350 | $0 | $0 |
| 2016 | $5,553 | $725,040 | $0 | $0 |
| 2015 | $5,164 | $678,910 | $0 | $0 |
| 2014 | $4,869 | $643,080 | $0 | $0 |
Source: Public Records
Map
Nearby Homes
- 633 E St SE
- 530 F Street Terrace SE
- 715 G St SE
- 418 7th St SE Unit 302
- 647 G St SE Unit 1
- 647 G St SE Unit 2
- 649 S Carolina Ave SE
- 524 6th St SE
- 600 G St SE
- 733 8th St SE Unit 303
- 733 8th St SE Unit 2
- 733 8th St SE Unit P-2
- 733 8th St SE Unit 301
- 733 8th St SE Unit 202
- 733 8th St SE Unit 304
- 733 8th St SE Unit 302
- 733 8th St SE Unit 1
- 535 6th St SE
- 513 10th St SE
- 515 6th St SE
- 506 7th St SE
- 510 7th St SE
- 504 7th St SE
- 502 7th St SE Unit SUITE 1B
- 502 7th St SE
- 701 E St SE Unit A
- 701 E St SE Unit B
- 701 E St SE Unit 1
- 701 E St SE
- 711 E St SE
- 522 7th St SE
- 717 E St SE
- 719 E St SE
- 507 8th St SE
- 507 7th St SE
- 509 7th St SE Unit B
- 509 7th St SE
- 511 7th St SE
- 521 7th St SE
- 505 8th St SE