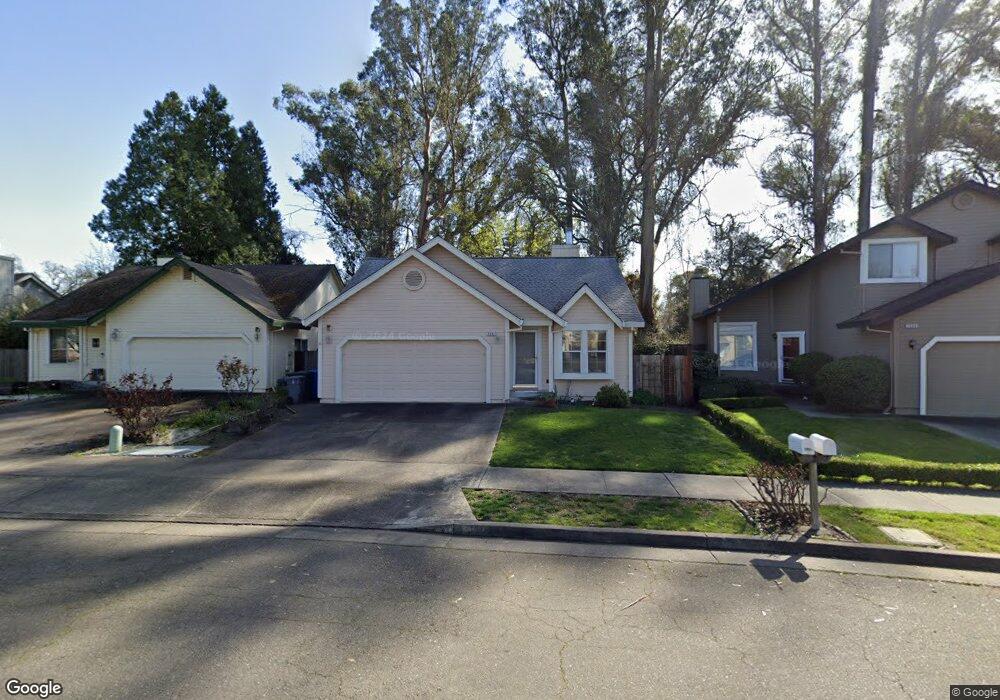
5082 Charmian Dr Santa Rosa, CA 95409
Estimated Value: $579,165 - $693,000
3
Beds
2
Baths
1,277
Sq Ft
$502/Sq Ft
Est. Value
About This Home
This home is located at 5082 Charmian Dr, Santa Rosa, CA 95409 and is currently estimated at $641,041, approximately $501 per square foot. 5082 Charmian Dr is a home located in Sonoma County with nearby schools including Rincon Valley Middle School, Maria Carrillo High School, and Whited Elementary Charter School.
Ownership History
Date
Name
Owned For
Owner Type
Purchase Details
Closed on
Sep 24, 2014
Sold by
Beck Leon R and Rozeboom Charlotte
Bought by
Rozeboom Charlotte and Charlotte Rozeboom Trust
Current Estimated Value
Purchase Details
Closed on
Jul 25, 2012
Sold by
Christensen Tamra L
Bought by
Beck Leon R and Beck Charlotte G
Purchase Details
Closed on
Aug 7, 2003
Sold by
Christensen Ross
Bought by
Christensen Tamra L
Purchase Details
Closed on
Jul 11, 2003
Sold by
Tyler Martha Ann Silva and Silva Martha Ann
Bought by
Christensen Tamra L
Purchase Details
Closed on
Oct 30, 2002
Sold by
Tyler Keith L
Bought by
Silva Martha Ann
Home Financials for this Owner
Home Financials are based on the most recent Mortgage that was taken out on this home.
Original Mortgage
$108,000
Interest Rate
5.95%
Create a Home Valuation Report for This Property
The Home Valuation Report is an in-depth analysis detailing your home's value as well as a comparison with similar homes in the area
Home Values in the Area
Average Home Value in this Area
Purchase History
| Date | Buyer | Sale Price | Title Company |
|---|---|---|---|
| Rozeboom Charlotte | -- | None Available | |
| Beck Leon R | $280,000 | Stewart Title Of California | |
| Christensen Tamra L | -- | Financial Title Co | |
| Christensen Tamra L | $445,000 | Financial Title Co | |
| Silva Martha Ann | -- | First American Title Co |
Source: Public Records
Mortgage History
| Date | Status | Borrower | Loan Amount |
|---|---|---|---|
| Previous Owner | Silva Martha Ann | $108,000 |
Source: Public Records
Tax History Compared to Growth
Tax History
| Year | Tax Paid | Tax Assessment Tax Assessment Total Assessment is a certain percentage of the fair market value that is determined by local assessors to be the total taxable value of land and additions on the property. | Land | Improvement |
|---|---|---|---|---|
| 2025 | $4,079 | $344,789 | $137,915 | $206,874 |
| 2024 | $4,079 | $338,029 | $135,211 | $202,818 |
| 2023 | $4,079 | $331,402 | $132,560 | $198,842 |
| 2022 | $3,769 | $324,905 | $129,961 | $194,944 |
| 2021 | $3,694 | $318,535 | $127,413 | $191,122 |
| 2020 | $3,681 | $315,270 | $126,107 | $189,163 |
| 2019 | $3,647 | $309,089 | $123,635 | $185,454 |
| 2018 | $3,625 | $303,029 | $121,211 | $181,818 |
| 2017 | $3,559 | $297,088 | $118,835 | $178,253 |
| 2016 | $3,517 | $291,263 | $116,505 | $174,758 |
| 2015 | $3,412 | $286,888 | $114,755 | $172,133 |
| 2014 | $3,289 | $281,270 | $112,508 | $168,762 |
Source: Public Records
Map
Nearby Homes
- 5086 Charmian Dr
- 5020 Roma St
- 206 Indian Creek Dr
- 5056 Fravel Ln
- 5015 Charmian Dr
- 305 Simone Place N
- 311 Algiers Ct
- 5088 Firestone Ct
- 537 Emerald Park Ct
- 4704 Venti Ln
- 184 El Encanto Way
- 4746 Bridle Trail
- 5518 Marit Dr
- 5534 Rainbow Cir
- 5682 Raters Dr
- 66 Coronado Cir
- 61 Coronado Cir
- 5201 San Luis Ave
- 5209 San Luis Ave
- 5426 Spring Lake Ct
- 5084 Charmian Dr
- 5080 Charmian Dr
- 5078 Charmian Dr
- 5088 Charmian Dr
- 5076 Charmian Dr
- 5075 Charmian Dr
- 5079 Charmian Dr
- 5069 Charmian Dr
- 5074 Charmian Dr
- 5090 Charmian Dr
- 5083 Charmian Dr
- 5072 Charmian Dr
- 5092 Charmian Dr
- 5087 Charmian Dr
- 117 Boas Dr
- 5061 Charmian Dr
- 5059 Charmian Dr
- 5058 Morocco Ave
- 119 Boas Dr