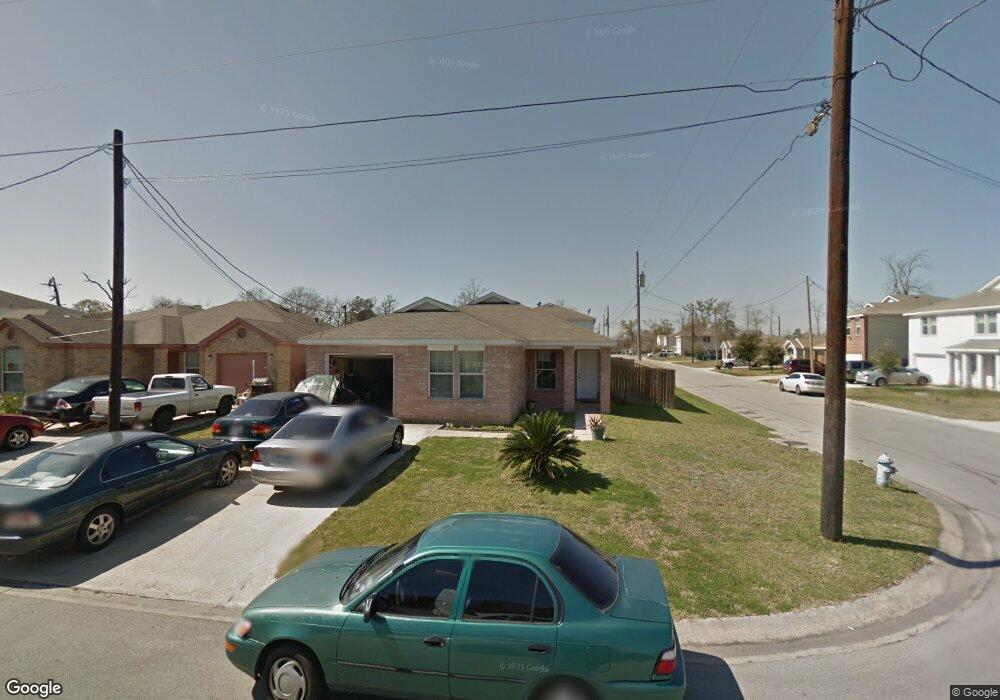
509 Oak Cluster Ct Conroe, TX 77301
Estimated Value: $216,801 - $232,000
--
Bed
--
Bath
1,410
Sq Ft
$158/Sq Ft
Est. Value
About This Home
This home is located at 509 Oak Cluster Ct, Conroe, TX 77301 and is currently estimated at $222,950, approximately $158 per square foot. 509 Oak Cluster Ct is a home located in Montgomery County with nearby schools including Patterson Elementary School, Bozman Intermediate School, and Stockton Junior High School.
Ownership History
Date
Name
Owned For
Owner Type
Purchase Details
Closed on
Jul 22, 2019
Sold by
Arredondo Mayra and Watson Sharon Denise
Bought by
Arredondo Mayra and Arredondo Alfredo
Current Estimated Value
Home Financials for this Owner
Home Financials are based on the most recent Mortgage that was taken out on this home.
Original Mortgage
$83,021
Outstanding Balance
$54,334
Interest Rate
3.7%
Mortgage Type
New Conventional
Estimated Equity
$168,616
Purchase Details
Closed on
May 10, 2010
Sold by
Torres Elias Mendez
Bought by
Mendez Mayra
Purchase Details
Closed on
Dec 30, 2006
Sold by
Grande Valley Homes Llc
Bought by
Torres Elias Mendez and Mendez Mayra
Home Financials for this Owner
Home Financials are based on the most recent Mortgage that was taken out on this home.
Original Mortgage
$90,230
Interest Rate
6.1%
Mortgage Type
Seller Take Back
Purchase Details
Closed on
Dec 16, 2005
Sold by
Rhk Enterprises
Bought by
Arredondo Mayra
Create a Home Valuation Report for This Property
The Home Valuation Report is an in-depth analysis detailing your home's value as well as a comparison with similar homes in the area
Home Values in the Area
Average Home Value in this Area
Purchase History
| Date | Buyer | Sale Price | Title Company |
|---|---|---|---|
| Arredondo Mayra | -- | First American Els | |
| Mendez Mayra | -- | None Available | |
| Torres Elias Mendez | -- | Stewart Title Of Montgomery | |
| Arredondo Mayra | -- | -- |
Source: Public Records
Mortgage History
| Date | Status | Borrower | Loan Amount |
|---|---|---|---|
| Open | Arredondo Mayra | $83,021 | |
| Previous Owner | Torres Elias Mendez | $90,230 |
Source: Public Records
Tax History Compared to Growth
Tax History
| Year | Tax Paid | Tax Assessment Tax Assessment Total Assessment is a certain percentage of the fair market value that is determined by local assessors to be the total taxable value of land and additions on the property. | Land | Improvement |
|---|---|---|---|---|
| 2025 | $4,176 | $204,642 | $12,500 | $192,142 |
| 2024 | $3,972 | $218,303 | $12,500 | $205,803 |
| 2023 | $3,972 | $207,260 | $12,500 | $194,760 |
| 2022 | $3,726 | $179,650 | $12,500 | $167,150 |
| 2021 | $2,909 | $133,040 | $12,500 | $120,540 |
| 2020 | $3,224 | $141,310 | $12,500 | $128,810 |
| 2019 | $3,167 | $135,820 | $12,500 | $129,620 |
| 2018 | $2,424 | $123,470 | $12,500 | $110,970 |
| 2017 | $2,759 | $117,870 | $12,500 | $110,970 |
| 2016 | $2,508 | $107,150 | $12,500 | $99,290 |
| 2015 | $1,890 | $97,410 | $12,500 | $106,100 |
| 2014 | $1,890 | $88,550 | $12,500 | $82,210 |
Source: Public Records
Map
Nearby Homes
- 508 Birch Cluster Ct
- 2315 Shady Tree Ln
- 2724 Cadiz Bay Dr
- 2741 Cadiz Bay Dr
- 2325 Shady Tree Ln
- 2325 Shady Pine Dr
- 283 Eastwood Dr
- 509 Dogwood Cluster Ct
- 2213 Ivy Wall Dr
- 2714 Discovery Trails Ct
- 2710 Discovery Trails Ct
- 2726 Discovery Trails Ct
- 2233 Oak Circle Dr N
- The Comal F Plan at Caney Creek Place
- The Blanco F Plan at Caney Creek Place
- The San Marcos F Plan at Caney Creek Place
- The Colorado F Plan at Caney Creek Place
- The Sabine F Plan at Caney Creek Place
- The Frio F Plan at Caney Creek Place
- The Brazos F Plan at Caney Creek Place
- 507 Oak Cluster Ct
- 505 Oak Cluster Ct
- 506 Birch Cluster Ct
- 2317 Shady Birch Dr
- 2315 Shady Birch Dr
- 2319 Shady Birch Dr
- 504 Birch Cluster Ct
- 503 Oak Cluster Ct
- 508 Oak Cluster Ct
- 506 Oak Cluster Ct
- 2313 Shady Birch Dr
- 502 Birch Cluster Ct
- 504 Oak Cluster Ct
- 2321 Shady Birch Dr
- 2311 Shady Birch Dr
- 501 Oak Cluster Ct
- 502 Oak Cluster Ct
- 2309 Shady Birch Dr
- 500 Birch Cluster Ct
- 2323 Shady Birch Dr