Estimated Value: $404,000 - $513,000
4
Beds
4
Baths
2,743
Sq Ft
$161/Sq Ft
Est. Value
About This Home
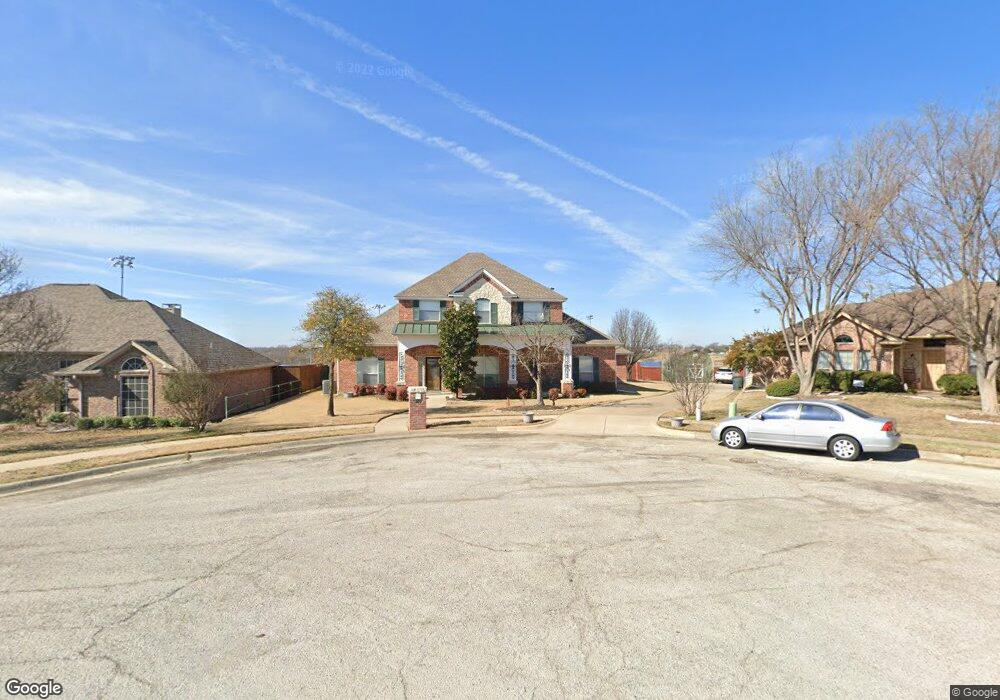
This home is located at 509 Park Ln, Krum, TX 76249 and is currently estimated at $442,805, approximately $161 per square foot. 509 Park Ln is a home located in Denton County with nearby schools including Krum Early Education Center, Dyer Elementary School, and Krum Middle School.
Ownership History
Date
Name
Owned For
Owner Type
Purchase Details
Closed on
Sep 28, 2021
Sold by
Mosely Jeffrey and Estate Of Clinton F Mosely
Bought by
Mosely Bobby Joe and Mosely Jerri Denise
Current Estimated Value
Purchase Details
Closed on
Apr 11, 2014
Sold by
Estate Of Betty J Mosely
Bought by
Mosely Clinton F
Purchase Details
Closed on
Apr 5, 2002
Sold by
Smith Steven Leroy and Smith Laurie D
Bought by
Mosley Clinton and Mosley Betty J
Home Financials for this Owner
Home Financials are based on the most recent Mortgage that was taken out on this home.
Original Mortgage
$82,875
Interest Rate
6.78%
Mortgage Type
Unknown
Purchase Details
Closed on
Aug 14, 2001
Sold by
Meadowview Estates Joint Venture
Bought by
Smith Steven Leroy and Smith Laurie D
Home Financials for this Owner
Home Financials are based on the most recent Mortgage that was taken out on this home.
Original Mortgage
$172,800
Interest Rate
7.16%
Mortgage Type
Purchase Money Mortgage
Create a Home Valuation Report for This Property
The Home Valuation Report is an in-depth analysis detailing your home's value as well as a comparison with similar homes in the area
Home Values in the Area
Average Home Value in this Area
Purchase History
| Date | Buyer | Sale Price | Title Company |
|---|---|---|---|
| Mosely Bobby Joe | -- | None Available | |
| Mosely Clinton F | -- | None Available | |
| Mosley Clinton | -- | -- | |
| Smith Steven Leroy | -- | -- | |
| Smith Steven Leroy | -- | -- |
Source: Public Records
Mortgage History
| Date | Status | Borrower | Loan Amount |
|---|---|---|---|
| Previous Owner | Mosley Clinton | $82,875 | |
| Previous Owner | Mosley Clinton | $100,000 | |
| Previous Owner | Smith Steven Leroy | $172,800 | |
| Previous Owner | Smith Steven Leroy | $22,500 |
Source: Public Records
Tax History Compared to Growth
Tax History
| Year | Tax Paid | Tax Assessment Tax Assessment Total Assessment is a certain percentage of the fair market value that is determined by local assessors to be the total taxable value of land and additions on the property. | Land | Improvement |
|---|---|---|---|---|
| 2025 | $8,610 | $419,344 | $75,429 | $343,915 |
| 2024 | $8,610 | $427,265 | $75,429 | $351,836 |
| 2023 | $9,194 | $455,346 | $75,429 | $379,917 |
| 2022 | $7,417 | $323,347 | $75,429 | $247,918 |
| 2021 | $6,443 | $290,540 | $56,862 | $233,678 |
| 2020 | $6,300 | $278,179 | $56,862 | $233,678 |
| 2019 | $6,102 | $252,890 | $56,862 | $233,214 |
| 2018 | $5,576 | $229,900 | $56,862 | $178,138 |
| 2017 | $5,091 | $209,000 | $56,862 | $183,138 |
| 2016 | $3,102 | $190,000 | $40,616 | $149,384 |
| 2015 | $3,133 | $187,000 | $40,616 | $146,384 |
| 2014 | $3,133 | $187,000 | $40,616 | $146,384 |
| 2013 | -- | $187,000 | $40,616 | $146,384 |
Source: Public Records
Map
Nearby Homes
- 407 Valley View Ln
- 511 W Lake St
- 102 Clearman St
- 342 W Huffman St
- 201 N 3rd St
- 31 Rogers Cir
- 503 N 2nd St
- TBD 5.3 ACRES Gregg Rd
- Tbd 5 3 Acres Gregg Rd
- 2 Finley Cir
- 1990
- 424 S 2nd St
- 430 S 2nd St
- 133 W Britton St
- 220 Brook Cir
- 421 Jackson St
- 8 S Sharon Dr
- 7257 Christina Ct
- 438 South St
- 7272 Christina Ct