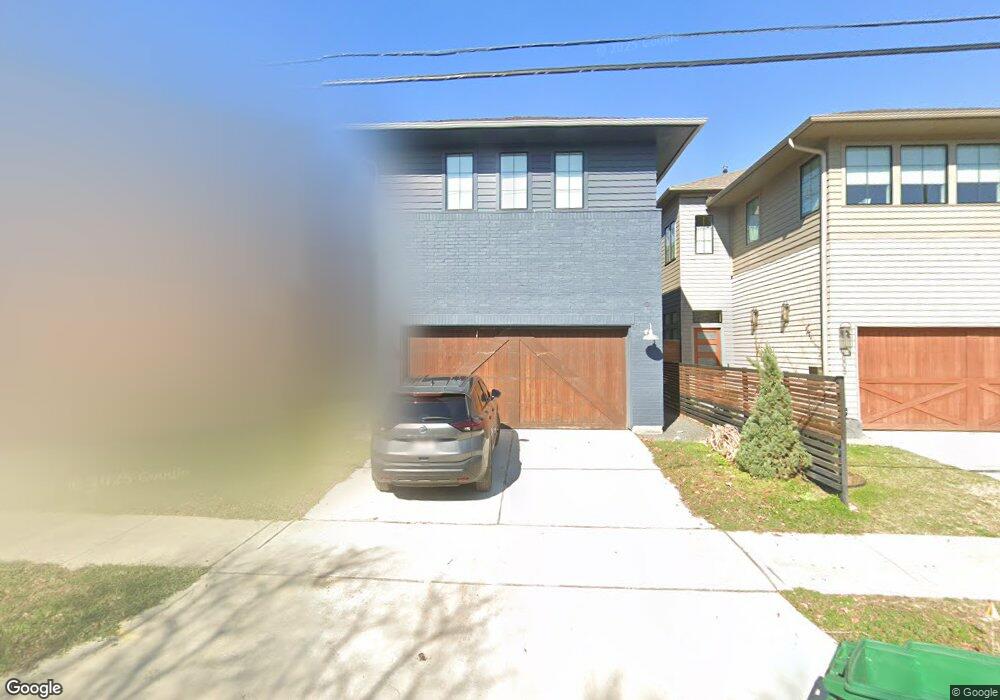
509 Redan St Houston, TX 77009
Greater Heights NeighborhoodEstimated Value: $1,302,527 - $1,621,000
4
Beds
4
Baths
3,807
Sq Ft
$388/Sq Ft
Est. Value
About This Home
This home is located at 509 Redan St, Houston, TX 77009 and is currently estimated at $1,476,632, approximately $387 per square foot. 509 Redan St is a home located in Harris County with nearby schools including Travis Elementary School, Hogg Middle, and Heights High School.
Ownership History
Date
Name
Owned For
Owner Type
Purchase Details
Closed on
Jul 25, 2019
Sold by
Falcone Daniel J and Falcone Jennifer B
Bought by
Rajaram Ravi and Rajaram Sonam
Current Estimated Value
Home Financials for this Owner
Home Financials are based on the most recent Mortgage that was taken out on this home.
Original Mortgage
$900,000
Outstanding Balance
$781,014
Interest Rate
3.37%
Mortgage Type
Adjustable Rate Mortgage/ARM
Estimated Equity
$695,618
Purchase Details
Closed on
Mar 28, 2018
Sold by
River Valley Developers Llc
Bought by
Falcone Daniel J and Falcone Jennifer B
Home Financials for this Owner
Home Financials are based on the most recent Mortgage that was taken out on this home.
Original Mortgage
$700,000
Interest Rate
4.38%
Mortgage Type
New Conventional
Create a Home Valuation Report for This Property
The Home Valuation Report is an in-depth analysis detailing your home's value as well as a comparison with similar homes in the area
Home Values in the Area
Average Home Value in this Area
Purchase History
| Date | Buyer | Sale Price | Title Company |
|---|---|---|---|
| Rajaram Ravi | -- | Fidelity National Title | |
| Falcone Daniel J | -- | Startex Title Agency Llc |
Source: Public Records
Mortgage History
| Date | Status | Borrower | Loan Amount |
|---|---|---|---|
| Open | Rajaram Ravi | $900,000 | |
| Previous Owner | Falcone Daniel J | $700,000 |
Source: Public Records
Tax History Compared to Growth
Tax History
| Year | Tax Paid | Tax Assessment Tax Assessment Total Assessment is a certain percentage of the fair market value that is determined by local assessors to be the total taxable value of land and additions on the property. | Land | Improvement |
|---|---|---|---|---|
| 2025 | $18,854 | $1,182,277 | $452,900 | $729,377 |
| 2024 | $18,854 | $1,176,219 | $430,255 | $745,964 |
| 2023 | $18,854 | $1,157,012 | $430,255 | $726,757 |
| 2022 | $23,302 | $1,058,284 | $430,255 | $628,029 |
| 2021 | $23,440 | $1,005,706 | $430,255 | $575,451 |
| 2020 | $23,788 | $982,319 | $339,675 | $642,644 |
| 2019 | $24,342 | $961,946 | $339,675 | $622,271 |
| 2018 | $22,141 | $875,000 | $317,030 | $557,970 |
| 2017 | $14,816 | $585,951 | $317,030 | $268,921 |
Source: Public Records
Map
Nearby Homes