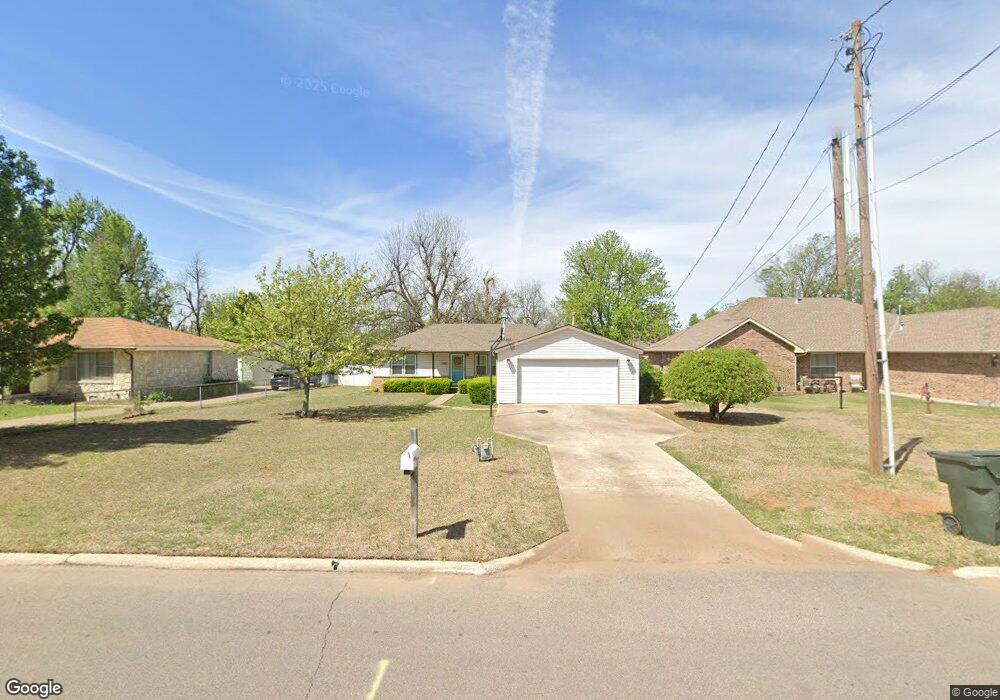
509 S Saint Paul Ave Oklahoma City, OK 73130
Estimated Value: $133,000 - $157,000
2
Beds
2
Baths
1,032
Sq Ft
$141/Sq Ft
Est. Value
About This Home
This home is located at 509 S Saint Paul Ave, Oklahoma City, OK 73130 and is currently estimated at $145,674, approximately $141 per square foot. 509 S Saint Paul Ave is a home located in Oklahoma County with nearby schools including Carl Albert Middle School, Carl Albert High School, and Insight School of Oklahoma High School.
Ownership History
Date
Name
Owned For
Owner Type
Purchase Details
Closed on
Aug 9, 2021
Sold by
Greenlee Jama J and Greenlee Michael E
Bought by
Greenlee Jama J and Greenlee Michael E
Current Estimated Value
Purchase Details
Closed on
Jul 27, 2021
Sold by
Claypool Jama J and Greenlee Jama J
Bought by
Greenlee Jama J and Greenlee Michael E
Purchase Details
Closed on
Apr 7, 2001
Sold by
Claypool Larry Dee
Bought by
Claypool Jana J
Create a Home Valuation Report for This Property
The Home Valuation Report is an in-depth analysis detailing your home's value as well as a comparison with similar homes in the area
Home Values in the Area
Average Home Value in this Area
Purchase History
| Date | Buyer | Sale Price | Title Company |
|---|---|---|---|
| Greenlee Jama J | -- | None Listed On Document | |
| Greenlee Jama J | -- | None Available | |
| Claypool Jana J | -- | -- |
Source: Public Records
Tax History Compared to Growth
Tax History
| Year | Tax Paid | Tax Assessment Tax Assessment Total Assessment is a certain percentage of the fair market value that is determined by local assessors to be the total taxable value of land and additions on the property. | Land | Improvement |
|---|---|---|---|---|
| 2024 | $927 | $9,140 | $953 | $8,187 |
| 2023 | $927 | $8,874 | $1,313 | $7,561 |
| 2022 | $888 | $8,615 | $1,393 | $7,222 |
| 2021 | $999 | $8,365 | $1,601 | $6,764 |
| 2020 | $978 | $7,967 | $1,579 | $6,388 |
| 2019 | $891 | $7,587 | $2,699 | $4,888 |
| 2018 | $797 | $7,227 | $0 | $0 |
| 2017 | $770 | $6,882 | $2,280 | $4,602 |
| 2016 | $754 | $6,554 | $2,199 | $4,355 |
| 2015 | $748 | $6,242 | $1,628 | $4,614 |
| 2014 | $755 | $6,307 | $1,628 | $4,679 |
Source: Public Records
Map
Nearby Homes
- 9909 Fox Fair Hollow
- 9412 Emily Ln
- 10107 Saint Patrick Dr
- 129 Oak Tree Dr
- 203 Oak Tree Ln
- 9408 S Caldwell Dr
- 121 Saint Charles Way
- 1010 S Caldwell Dr
- 9704 NE 2nd St
- 10236 Bellmont Ave
- 9225 Ruth Dr
- 724 Three Oaks Dr
- 9252 Elaine Dr
- 000 Tbd Bellview Dr
- 10305 Saint Patrick Dr
- 9211 Whispering Oak Dr
- 9621 Montclaire Dr
- 9604 NE 3rd St
- 9700 Woodrock Place
- 1232 Three Oaks Cir
- 505 S Saint Paul Ave
- 513 S Saint Paul Ave
- 501 S Saint Paul Ave
- 517 S Saint Paul Ave
- 9632 SE 4th St
- 9630 SE 4th St
- 521 S Saint Paul Ave
- 518 S Saint Paul Ave
- 531 S Saint Paul Ave
- 527 S Saint Paul Ave
- 520 S Saint Paul Ave
- 407 S Saint Paul Ave
- 9628 SE 4th St
- 500 S Saint Paul Ave
- 9633 SE 4th St
- 405 S Saint Paul Ave
- 9631 SE 4th St
- 412 S Saint Paul Ave
- 601 S Saint Paul Ave
- 9629 SE 4th St