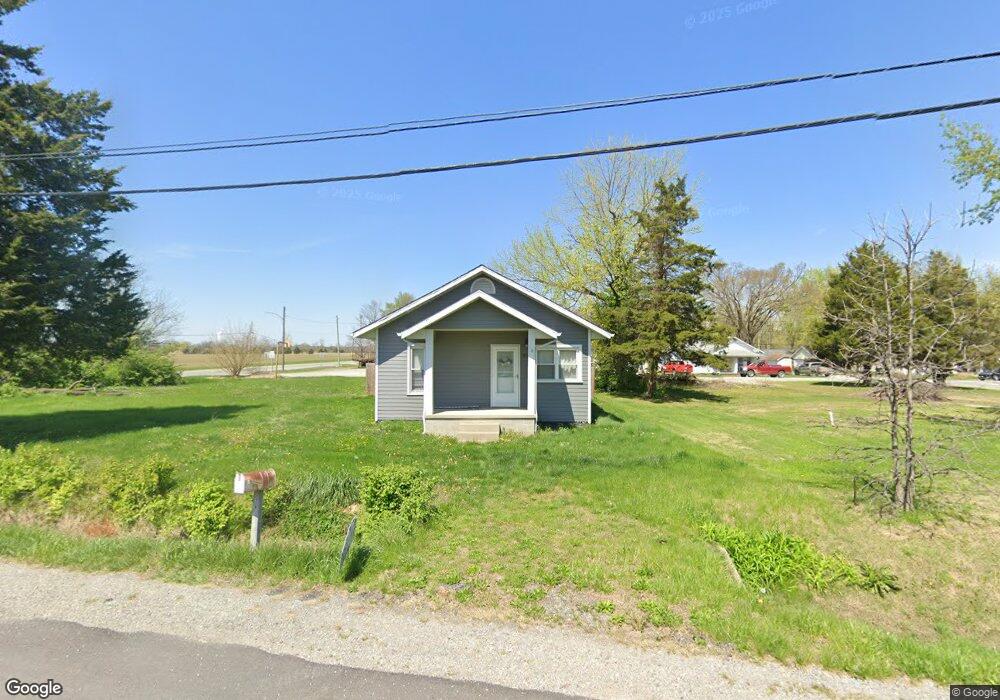
509 W Grant St Coulterville, IL 62237
Estimated Value: $93,552 - $106,000
2
Beds
1
Bath
728
Sq Ft
$135/Sq Ft
Est. Value
About This Home
This home is located at 509 W Grant St, Coulterville, IL 62237 and is currently estimated at $98,388, approximately $135 per square foot. 509 W Grant St is a home located in Randolph County with nearby schools including Coulterville CUSD 1, Coulterville Junior High School, and Coulterville High School.
Ownership History
Date
Name
Owned For
Owner Type
Purchase Details
Closed on
Oct 25, 2021
Sold by
Parkinson Michael D and Parkinson Kelly J
Bought by
Pearman Jayda
Current Estimated Value
Home Financials for this Owner
Home Financials are based on the most recent Mortgage that was taken out on this home.
Original Mortgage
$77,777
Outstanding Balance
$71,505
Interest Rate
3.38%
Mortgage Type
New Conventional
Estimated Equity
$26,883
Create a Home Valuation Report for This Property
The Home Valuation Report is an in-depth analysis detailing your home's value as well as a comparison with similar homes in the area
Home Values in the Area
Average Home Value in this Area
Purchase History
| Date | Buyer | Sale Price | Title Company |
|---|---|---|---|
| Pearman Jayda | $75,000 | None Available |
Source: Public Records
Mortgage History
| Date | Status | Borrower | Loan Amount |
|---|---|---|---|
| Open | Pearman Jayda | $77,777 |
Source: Public Records
Tax History Compared to Growth
Tax History
| Year | Tax Paid | Tax Assessment Tax Assessment Total Assessment is a certain percentage of the fair market value that is determined by local assessors to be the total taxable value of land and additions on the property. | Land | Improvement |
|---|---|---|---|---|
| 2024 | $1,706 | $26,090 | $9,935 | $16,155 |
| 2023 | $1,549 | $24,240 | $9,230 | $15,010 |
| 2022 | $1,780 | $27,170 | $9,230 | $17,940 |
| 2021 | $1,104 | $13,000 | $2,440 | $10,560 |
| 2020 | $1,225 | $13,377 | $2,512 | $10,865 |
| 2019 | $1,145 | $13,280 | $2,495 | $10,785 |
| 2018 | $1,184 | $14,641 | $2,751 | $11,890 |
| 2017 | $1,089 | $13,395 | $2,515 | $10,880 |
| 2016 | $1,041 | $12,910 | $2,425 | $10,485 |
| 2015 | $1,120 | $12,910 | $2,425 | $10,485 |
| 2014 | $1,120 | $13,165 | $2,475 | $10,690 |
| 2013 | $1,094 | $13,330 | $2,505 | $10,825 |
Source: Public Records
Map
Nearby Homes
- 115 S 4th St
- 9199 Schupbach Rd
- 302 Walnut St
- 521 Cherry St
- 378 Butler St
- 751 Torrens St
- 718 N Illinois St
- 331 N Minnie Ave
- 2076 Carter Rd
- 2821 N Market St
- 143 Taft St
- 2125 N Market St
- 1821 Mark Dr
- 151 Doc Lin Dr
- 0 Flamingo Dr
- 1019 E Broadway St
- 712 E Harrison St
- 520 E Mound St
- 1125 N Market St
- 321 Sunset Dr