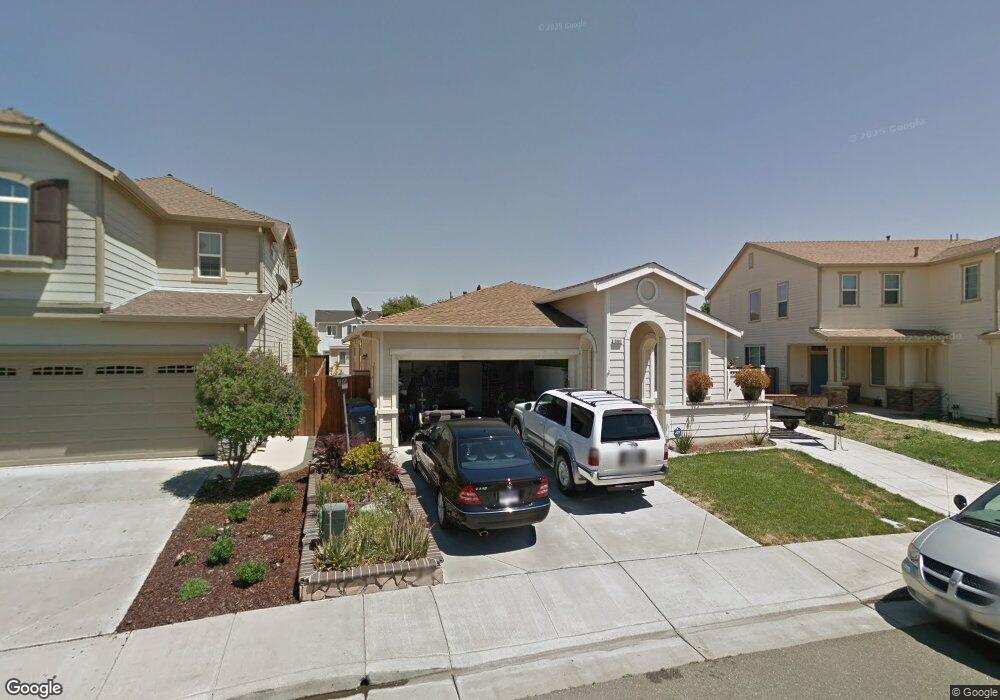
5092 Bickford Cir Fairfield, CA 94533
Estimated Value: $571,000 - $600,000
3
Beds
2
Baths
1,642
Sq Ft
$353/Sq Ft
Est. Value
About This Home
This home is located at 5092 Bickford Cir, Fairfield, CA 94533 and is currently estimated at $579,694, approximately $353 per square foot. 5092 Bickford Cir is a home located in Solano County with nearby schools including Center Elementary School, Golden West Middle School, and Vanden High School.
Ownership History
Date
Name
Owned For
Owner Type
Purchase Details
Closed on
Aug 29, 2017
Sold by
Campos Lester and Campos Judith
Bought by
Campos Lester C and Campos Judith Cahilog
Current Estimated Value
Purchase Details
Closed on
Jun 22, 2017
Sold by
Coy Olga C
Bought by
Campos Lester and Campos Judith
Home Financials for this Owner
Home Financials are based on the most recent Mortgage that was taken out on this home.
Original Mortgage
$366,415
Outstanding Balance
$304,195
Interest Rate
3.95%
Mortgage Type
VA
Estimated Equity
$275,499
Purchase Details
Closed on
May 13, 2016
Sold by
Todd Brian G and Todd Bridget M
Bought by
Silezar Luis A and Silezar Erica
Purchase Details
Closed on
May 20, 2003
Sold by
Richmond American Homes Of Ca Inc
Bought by
Coy Olga C
Home Financials for this Owner
Home Financials are based on the most recent Mortgage that was taken out on this home.
Original Mortgage
$273,350
Interest Rate
5.75%
Mortgage Type
Purchase Money Mortgage
Create a Home Valuation Report for This Property
The Home Valuation Report is an in-depth analysis detailing your home's value as well as a comparison with similar homes in the area
Home Values in the Area
Average Home Value in this Area
Purchase History
| Date | Buyer | Sale Price | Title Company |
|---|---|---|---|
| Campos Lester C | -- | None Available | |
| Campos Lester | $380,000 | Fidelity National Title Co | |
| Silezar Luis A | $425,000 | Old Republic Title Company | |
| Coy Olga C | $347,000 | First American Title Co |
Source: Public Records
Mortgage History
| Date | Status | Borrower | Loan Amount |
|---|---|---|---|
| Open | Campos Lester | $366,415 | |
| Previous Owner | Coy Olga C | $273,350 | |
| Closed | Coy Olga C | $34,150 |
Source: Public Records
Tax History Compared to Growth
Tax History
| Year | Tax Paid | Tax Assessment Tax Assessment Total Assessment is a certain percentage of the fair market value that is determined by local assessors to be the total taxable value of land and additions on the property. | Land | Improvement |
|---|---|---|---|---|
| 2025 | $6,075 | $441,017 | $116,056 | $324,961 |
| 2024 | $6,075 | $432,371 | $113,781 | $318,590 |
| 2023 | $6,008 | $423,894 | $111,550 | $312,344 |
| 2022 | $5,757 | $415,583 | $109,363 | $306,220 |
| 2021 | $5,676 | $407,435 | $107,219 | $300,216 |
| 2020 | $5,601 | $403,258 | $106,120 | $297,138 |
| 2019 | $5,502 | $395,352 | $104,040 | $291,312 |
| 2018 | $5,430 | $387,600 | $102,000 | $285,600 |
| 2017 | $5,451 | $397,000 | $67,000 | $330,000 |
| 2016 | $4,995 | $353,000 | $63,000 | $290,000 |
| 2015 | $4,743 | $331,000 | $60,000 | $271,000 |
| 2014 | $4,462 | $306,000 | $58,000 | $248,000 |
Source: Public Records
Map
Nearby Homes
- 2541 Rowe Dr
- 2438 Sheldon Dr
- 2472 Shorey Way
- 5041 N Parr Ln
- 5311 Gramercy Cir
- 5206 Conley Ln
- 5348 Gramercy Cir
- 5277 Shumway Place
- 5291 Finkas Ln
- 2746 Gracie Place
- 5383 Elan Dr
- 5114 Rasmussen Way
- 2433 Sanders Ln
- 2437 Sanders Ln
- 2326 Ray Venning Ct
- 5299 Elmquest Ct
- 5378 Discovery Way
- 5360 Discovery Way
- 6012 Big Sky Dr
- 5348 Discovery Way
- 5088 Bickford Cir
- 5096 Bickford Cir
- 5084 Bickford Cir
- 5100 Bickford Cir
- 5089 Bickford Cir
- 5104 Bickford Cir
- 5085 Bickford Cir
- 5082 Bickford Place
- 5070 Digerud Dr
- 5078 Digerud Dr
- 5062 Digerud Dr
- 5086 Digerud Dr
- 5054 Digerud Dr
- 5081 Bickford Cir
- 5094 Digerud Dr
- 5108 Bickford Cir
- 5080 Bickford Cir
- 5078 Bickford Place
- 5098 Digerud Dr