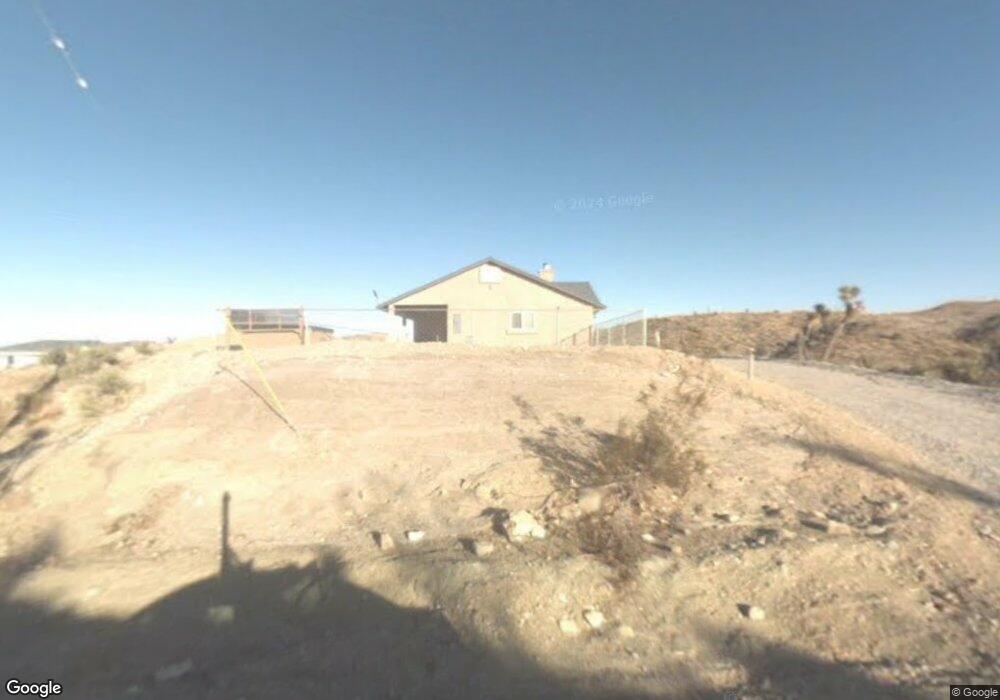
5099 Balsa Ave Yucca Valley, CA 92284
Estimated Value: $344,722 - $420,000
3
Beds
2
Baths
1,473
Sq Ft
$257/Sq Ft
Est. Value
About This Home
This home is located at 5099 Balsa Ave, Yucca Valley, CA 92284 and is currently estimated at $377,931, approximately $256 per square foot. 5099 Balsa Ave is a home with nearby schools including Yucca Mesa Elementary School, La Contenta Middle School, and Yucca Valley High School.
Ownership History
Date
Name
Owned For
Owner Type
Purchase Details
Closed on
Jun 8, 2021
Sold by
Leaphart Daniel C
Bought by
Leaphart Daniel C and Daniel C Leaphart Revocable Tr
Current Estimated Value
Purchase Details
Closed on
Oct 20, 2012
Sold by
Friedman Melissa Michael
Bought by
Leaphart Daniel C
Home Financials for this Owner
Home Financials are based on the most recent Mortgage that was taken out on this home.
Original Mortgage
$148,000
Interest Rate
4.4%
Mortgage Type
New Conventional
Purchase Details
Closed on
Sep 27, 2006
Sold by
Shovey James L
Bought by
Friedman Wayne Eric and Friedman Melissa Michael
Home Financials for this Owner
Home Financials are based on the most recent Mortgage that was taken out on this home.
Original Mortgage
$220,000
Interest Rate
6.32%
Mortgage Type
Purchase Money Mortgage
Purchase Details
Closed on
Jul 26, 2005
Sold by
Martin Stanislava
Bought by
Martin Lawrence W
Create a Home Valuation Report for This Property
The Home Valuation Report is an in-depth analysis detailing your home's value as well as a comparison with similar homes in the area
Home Values in the Area
Average Home Value in this Area
Purchase History
| Date | Buyer | Sale Price | Title Company |
|---|---|---|---|
| Leaphart Daniel C | -- | None Available | |
| Leaphart Daniel C | $185,000 | Orange Coast Title Company | |
| Friedman Melissa Michael | -- | None Available | |
| Friedman Wayne Eric | $275,000 | United Title | |
| Martin Lawrence W | -- | -- | |
| Shovey James L | -- | -- |
Source: Public Records
Mortgage History
| Date | Status | Borrower | Loan Amount |
|---|---|---|---|
| Previous Owner | Leaphart Daniel C | $148,000 | |
| Previous Owner | Friedman Wayne Eric | $220,000 |
Source: Public Records
Tax History Compared to Growth
Tax History
| Year | Tax Paid | Tax Assessment Tax Assessment Total Assessment is a certain percentage of the fair market value that is determined by local assessors to be the total taxable value of land and additions on the property. | Land | Improvement |
|---|---|---|---|---|
| 2025 | $2,886 | $210,497 | $42,099 | $168,398 |
| 2024 | $2,886 | $206,370 | $41,274 | $165,096 |
| 2023 | $2,785 | $202,324 | $40,465 | $161,859 |
| 2022 | $2,658 | $198,357 | $39,672 | $158,685 |
| 2021 | $2,629 | $194,468 | $38,894 | $155,574 |
| 2020 | $2,597 | $192,474 | $38,495 | $153,979 |
| 2019 | $2,489 | $188,700 | $37,740 | $150,960 |
| 2018 | $2,045 | $163,600 | $40,300 | $123,300 |
| 2017 | $1,920 | $152,200 | $37,500 | $114,700 |
| 2016 | $1,815 | $143,600 | $35,400 | $108,200 |
| 2015 | $1,731 | $138,000 | $34,000 | $104,000 |
| 2014 | $1,827 | $144,000 | $36,000 | $108,000 |
Source: Public Records
Map
Nearby Homes
- 0 Balsa Ave Unit IG25122042
- 0 Balsa Ave Unit JT25169495
- 58250 Sierra Vista Dr
- 58247 Buena Vista Dr
- 57785 Sierra Vista Dr
- 58425 Sierra Vista Dr
- 5115 Warren Vista Ave
- 0000 Sun Mesa Dr
- 7022 Avalon Ave
- 1 Avalon Ave
- 56825 Sun Oro Rd
- 58235 Sun Via Dr
- 0 Faith Ln
- 0 Ocotillo Dr Unit JT25221731
- 4689 Palo Alto Ave
- 57669 Lowe Ave
- 58587 Oleander Dr
- 0 Lot 5 Sec 30 Tp 1n R 6e Unit 24-389991
- 58706 Buena Vista Dr
- 0 Sun Via Dr Unit JT25181795
- 5077 Balsa Ave
- 58175 Aurora Dr
- 0 Balsa Ave Unit DC21126396
- 0 Balsa Ave Unit DC21126962
- 0 Balsa Ave Unit I10078077
- 0 Balsa Ave Unit DC12108813
- 0 Balsa Ave Unit IV12129508
- 0 Balsa Ave Unit IV14133842
- 0 Balsa Ave Unit IV14161279
- 0 Balsa Ave Unit DC14195390
- 0 Balsa Ave Unit DC14221319
- 0 Balsa Ave Unit DC14230042
- 0 Balsa Ave Unit DC14246628
- 0 Balsa Ave Unit OC15095426
- 0 Balsa Ave Unit OC15095343
- 0 Balsa Ave Unit OC15095324
- 0 Balsa Ave Unit JT15162708
- 0 Balsa Ave Unit JT17201986
- 0 Balsa Ave Unit IV16065838
- 0 Balsa Ave Unit JT17186404