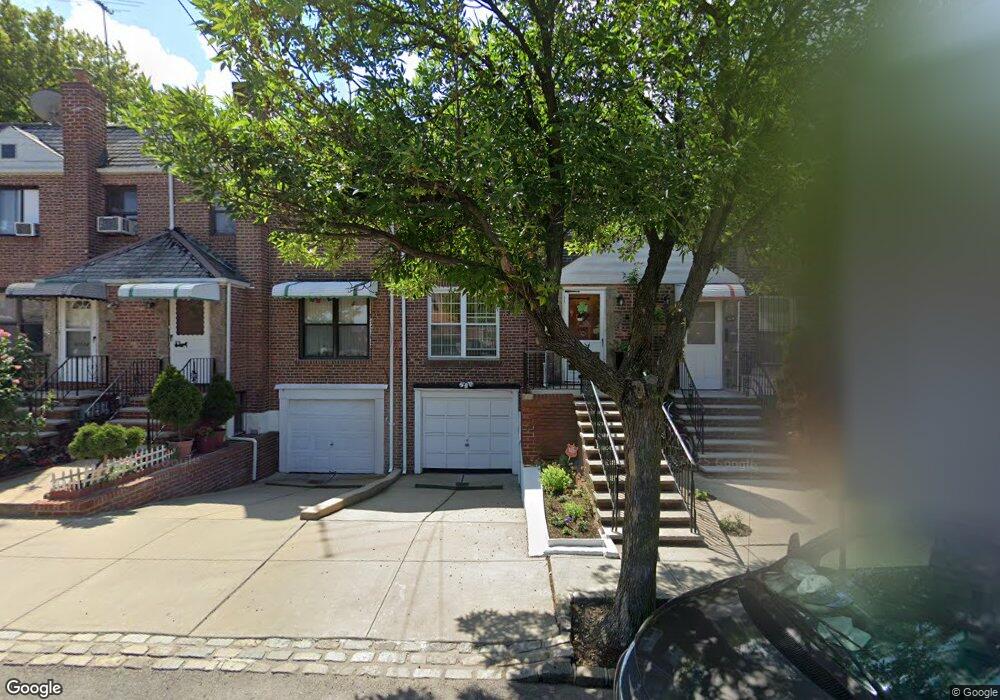
51-16? Jacobus St Elmhurst, NY 11373
Elmhurst NeighborhoodEstimated Value: $885,000 - $1,035,000
--
Bed
3
Baths
1,237
Sq Ft
$770/Sq Ft
Est. Value
About This Home
This home is located at 51-16? Jacobus St, Elmhurst, NY 11373 and is currently estimated at $952,321, approximately $769 per square foot. 51-16? Jacobus St is a home located in Queens County with nearby schools including P.S. 102 Bayview, Is 5 The Walter Crowley Intermediate School, and Newtown High School.
Ownership History
Date
Name
Owned For
Owner Type
Purchase Details
Closed on
Aug 16, 2018
Sold by
Bullard Krystal
Bought by
Chen Ben Lu
Current Estimated Value
Home Financials for this Owner
Home Financials are based on the most recent Mortgage that was taken out on this home.
Original Mortgage
$591,000
Outstanding Balance
$513,260
Interest Rate
4.5%
Mortgage Type
Purchase Money Mortgage
Estimated Equity
$439,061
Purchase Details
Closed on
Jun 20, 2016
Sold by
Mei Jun Qiang and Mei Miao Ling
Bought by
Bullard Krystal
Home Financials for this Owner
Home Financials are based on the most recent Mortgage that was taken out on this home.
Original Mortgage
$535,000
Interest Rate
3.64%
Mortgage Type
Purchase Money Mortgage
Purchase Details
Closed on
Jan 11, 2000
Sold by
Lochan Rajeev
Bought by
Mei Jun Qiang and Mei Miao Ling
Home Financials for this Owner
Home Financials are based on the most recent Mortgage that was taken out on this home.
Original Mortgage
$136,000
Interest Rate
7.98%
Create a Home Valuation Report for This Property
The Home Valuation Report is an in-depth analysis detailing your home's value as well as a comparison with similar homes in the area
Home Values in the Area
Average Home Value in this Area
Purchase History
| Date | Buyer | Sale Price | Title Company |
|---|---|---|---|
| Chen Ben Lu | $985,000 | -- | |
| Bullard Krystal | $835,000 | -- | |
| Mei Jun Qiang | $236,000 | -- |
Source: Public Records
Mortgage History
| Date | Status | Borrower | Loan Amount |
|---|---|---|---|
| Open | Chen Ben Lu | $591,000 | |
| Previous Owner | Bullard Krystal | $535,000 | |
| Previous Owner | Mei Jun Qiang | $136,000 | |
| Closed | Mei Jun Qiang | $10,000 |
Source: Public Records
Tax History Compared to Growth
Tax History
| Year | Tax Paid | Tax Assessment Tax Assessment Total Assessment is a certain percentage of the fair market value that is determined by local assessors to be the total taxable value of land and additions on the property. | Land | Improvement |
|---|---|---|---|---|
| 2025 | $6,945 | $36,654 | $9,376 | $27,278 |
| 2024 | $6,945 | $34,579 | $9,372 | $25,207 |
| 2023 | $6,553 | $32,624 | $7,984 | $24,640 |
| 2022 | $6,287 | $53,340 | $13,920 | $39,420 |
| 2021 | $6,757 | $52,140 | $13,920 | $38,220 |
| 2020 | $6,465 | $48,780 | $13,920 | $34,860 |
| 2019 | $6,028 | $42,840 | $13,920 | $28,920 |
| 2018 | $5,542 | $27,187 | $9,275 | $17,912 |
| 2017 | $5,154 | $26,755 | $9,506 | $17,249 |
| 2016 | $5,039 | $26,755 | $9,506 | $17,249 |
| 2015 | $3,044 | $25,454 | $12,557 | $12,897 |
| 2014 | $3,044 | $24,014 | $12,172 | $11,842 |
Source: Public Records
Map
Nearby Homes
- 5119 Ireland St
- 7408 46th Ave
- 74-47 Calamus Ave Unit 48
- 78-06 46th Ave Unit 6F
- 78-06 46th Ave Unit 6C
- 78-06 46th Ave Unit 2
- 74-49 Calamus Cir Unit 3rd FL
- 0 Island Rd Unit S1604113
- 73-37 52nd Ave
- 79-19 Calamus Ave
- 4607 79th St
- 70-65 Queens Blvd Unit 1A
- 70-65 Queens Blvd Unit 3I
- 70-65 Queens Blvd Unit 3M
- 70-65 Queens Blvd Unit 8D
- 70-65 Queens Blvd Unit 3L
- 70-65 Queens Blvd Unit 7E
- 79-15 Kneeland Ave
- 80-06 47th Ave Unit 1E
- 8006 47th Ave Unit 5A
- 5104 Jacobus St
- 5106 Jacobus St
- 5108 Jacobus St
- 5110 Jacobus St
- 51-03 Jacobus St
- 51-03 Jacobus St Unit 1 Fl
- 51-12 Jacobus St Unit 2nd Fl
- 51-12 Jacobus St Unit 2 Fl
- 5112 Jacobus St
- 5103 Jacobus St
- 5105 Jacobus St
- 5114 Jacobus St Unit 2nd Fl
- 5114 Jacobus St
- 5114 Jacobus St Unit 1/F
- 5101 Jacobus St
- 5107 Jacobus St
- 7502 51st Ave
- 51-07 Jacobus St
- 5116 Jacobus St
- 5109 Jacobus St