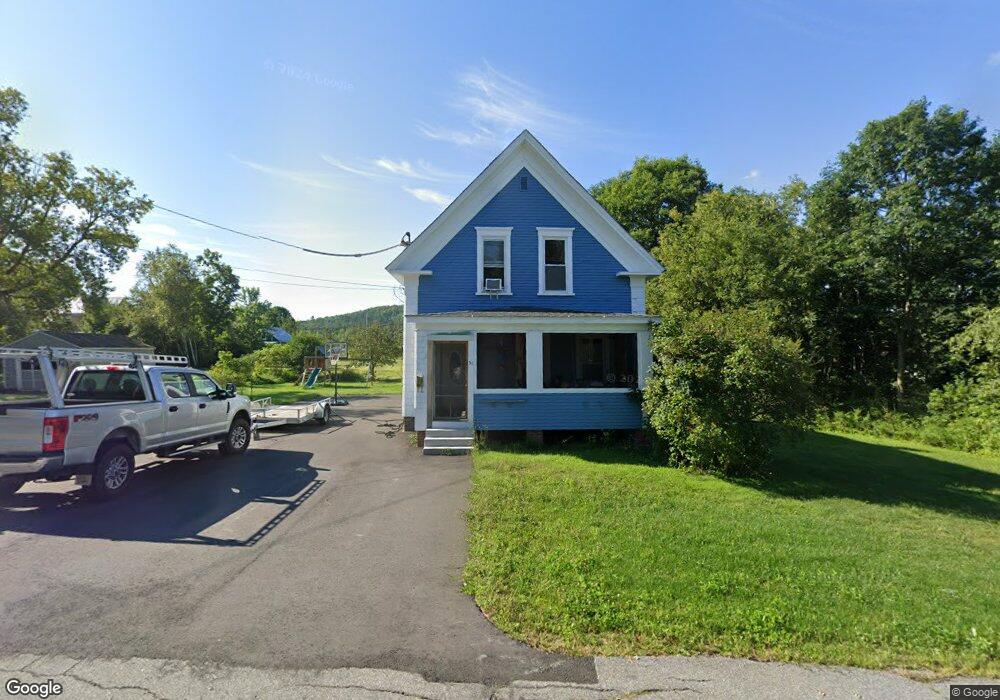
51 Bunker Hill St Lancaster, NH 03584
Estimated Value: $226,000 - $313,000
3
Beds
2
Baths
2,147
Sq Ft
$132/Sq Ft
Est. Value
About This Home
This home is located at 51 Bunker Hill St, Lancaster, NH 03584 and is currently estimated at $283,871, approximately $132 per square foot. 51 Bunker Hill St is a home located in Coos County with nearby schools including Lancaster Elementary School, White Mountains Regional High School, and North Country Charter Academy Lancaster (M).
Ownership History
Date
Name
Owned For
Owner Type
Purchase Details
Closed on
Apr 27, 2010
Sold by
Deutsche Bk Natl T Co
Bought by
Whipple Sierria V and Whipple Justin L
Current Estimated Value
Home Financials for this Owner
Home Financials are based on the most recent Mortgage that was taken out on this home.
Original Mortgage
$91,801
Outstanding Balance
$61,380
Interest Rate
5%
Mortgage Type
Purchase Money Mortgage
Estimated Equity
$222,491
Purchase Details
Closed on
Nov 5, 2009
Sold by
Field Brandon J
Bought by
Deutsche Bk Natl T Co
Purchase Details
Closed on
Aug 30, 2005
Sold by
Cronauer Alan B and Cronauer Monica A
Bought by
Field Brandon J and Field Angela I
Home Financials for this Owner
Home Financials are based on the most recent Mortgage that was taken out on this home.
Original Mortgage
$127,075
Interest Rate
5.68%
Create a Home Valuation Report for This Property
The Home Valuation Report is an in-depth analysis detailing your home's value as well as a comparison with similar homes in the area
Home Values in the Area
Average Home Value in this Area
Purchase History
| Date | Buyer | Sale Price | Title Company |
|---|---|---|---|
| Whipple Sierria V | $90,000 | -- | |
| Deutsche Bk Natl T Co | $127,500 | -- | |
| Field Brandon J | $149,500 | -- |
Source: Public Records
Mortgage History
| Date | Status | Borrower | Loan Amount |
|---|---|---|---|
| Open | Field Brandon J | $91,801 | |
| Previous Owner | Field Brandon J | $202,500 | |
| Previous Owner | Field Brandon J | $127,075 |
Source: Public Records
Tax History Compared to Growth
Tax History
| Year | Tax Paid | Tax Assessment Tax Assessment Total Assessment is a certain percentage of the fair market value that is determined by local assessors to be the total taxable value of land and additions on the property. | Land | Improvement |
|---|---|---|---|---|
| 2024 | $4,342 | $226,400 | $48,100 | $178,300 |
| 2023 | $3,919 | $226,400 | $48,100 | $178,300 |
| 2022 | $3,447 | $141,900 | $27,100 | $114,800 |
| 2021 | $3,716 | $141,900 | $27,100 | $114,800 |
| 2020 | $3,511 | $141,900 | $27,100 | $114,800 |
| 2019 | $3,503 | $140,700 | $27,100 | $113,600 |
| 2018 | $3,686 | $140,900 | $27,100 | $113,800 |
| 2017 | $3,769 | $143,100 | $27,100 | $116,000 |
| 2016 | $3,665 | $143,100 | $27,100 | $116,000 |
| 2015 | $3,934 | $143,100 | $27,100 | $116,000 |
| 2014 | $3,349 | $143,100 | $27,100 | $116,000 |
| 2013 | $3,341 | $143,100 | $27,100 | $116,000 |
Source: Public Records
Map
Nearby Homes
- 49 Middle St
- 12 High St
- 8 Williams St
- 90 Bunker Hill St
- 8 Richardson St
- 44 Prospect St
- 39 Elm St
- 13 Water St
- 000 Spring St
- 44 Elm St
- 5 Cubb St
- 68 Prospect St
- 0 N Main St Unit 5049939
- 140 Middle St
- Lot 26 Hartco Ave
- Lot 21 Hartco Ave
- Lot 11 Hartco Ave
- Lot 14 Hartco Ave
- Lot 9 Hartco Ave
- Lot 24 Hartco Ave