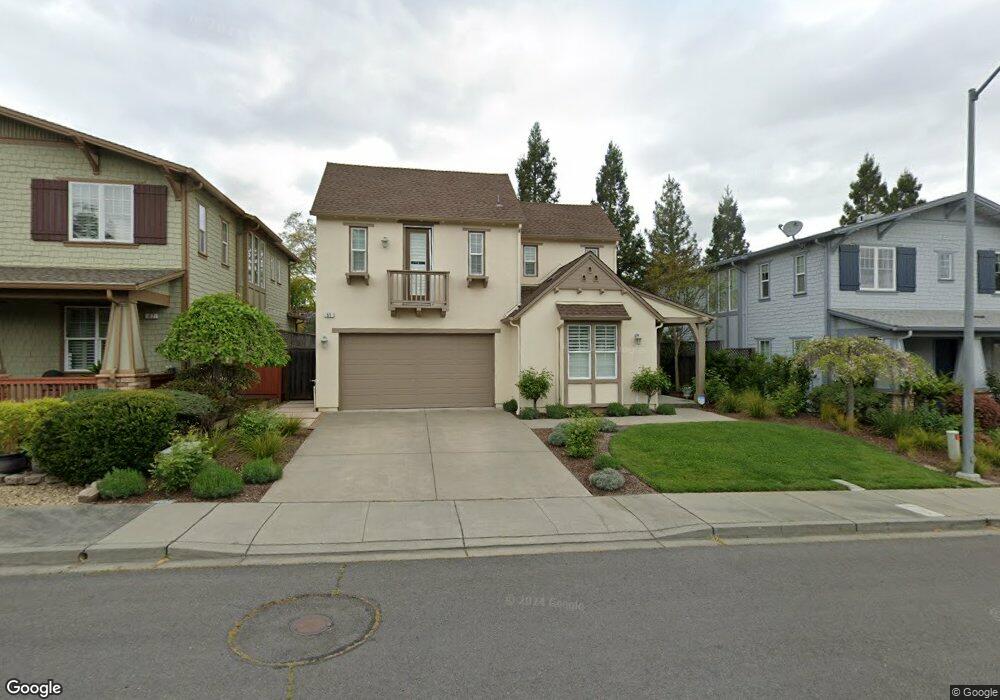
51 Catania Ln Napa, CA 94558
Vintage NeighborhoodEstimated Value: $1,075,034 - $1,382,000
3
Beds
3
Baths
2,364
Sq Ft
$514/Sq Ft
Est. Value
About This Home
This home is located at 51 Catania Ln, Napa, CA 94558 and is currently estimated at $1,214,759, approximately $513 per square foot. 51 Catania Ln is a home located in Napa County with nearby schools including Bel Aire Park Elementary School, Redwood Middle School, and Vintage High School.
Ownership History
Date
Name
Owned For
Owner Type
Purchase Details
Closed on
Sep 17, 2015
Sold by
Diaz Thomas Scott and Raineri Rhonda
Bought by
Foust John and Foust Dreanne Troy
Current Estimated Value
Home Financials for this Owner
Home Financials are based on the most recent Mortgage that was taken out on this home.
Original Mortgage
$599,200
Outstanding Balance
$470,472
Interest Rate
3.9%
Mortgage Type
New Conventional
Estimated Equity
$744,287
Purchase Details
Closed on
May 27, 2013
Sold by
Diaz Thomas S and Raineri Rhonda
Bought by
Diaz Thomas Scott and Raineri Rhonda
Purchase Details
Closed on
Jan 28, 2009
Sold by
St James Napa Development Llc
Bought by
Diaz Thomas S and Raineri Rhonda
Home Financials for this Owner
Home Financials are based on the most recent Mortgage that was taken out on this home.
Original Mortgage
$602,614
Interest Rate
5.04%
Mortgage Type
FHA
Create a Home Valuation Report for This Property
The Home Valuation Report is an in-depth analysis detailing your home's value as well as a comparison with similar homes in the area
Home Values in the Area
Average Home Value in this Area
Purchase History
| Date | Buyer | Sale Price | Title Company |
|---|---|---|---|
| Foust John | $749,000 | First American Title Co Napa | |
| Diaz Thomas Scott | -- | None Available | |
| Diaz Thomas S | $640,000 | Old Republic Title Company |
Source: Public Records
Mortgage History
| Date | Status | Borrower | Loan Amount |
|---|---|---|---|
| Open | Foust John | $599,200 | |
| Previous Owner | Diaz Thomas S | $602,614 |
Source: Public Records
Tax History Compared to Growth
Tax History
| Year | Tax Paid | Tax Assessment Tax Assessment Total Assessment is a certain percentage of the fair market value that is determined by local assessors to be the total taxable value of land and additions on the property. | Land | Improvement |
|---|---|---|---|---|
| 2025 | $10,358 | $886,656 | $355,136 | $531,520 |
| 2024 | $10,358 | $869,272 | $348,173 | $521,099 |
| 2023 | $10,358 | $852,229 | $341,347 | $510,882 |
| 2022 | $10,041 | $835,519 | $334,654 | $500,865 |
| 2021 | $9,899 | $819,138 | $328,093 | $491,045 |
| 2020 | $9,826 | $810,739 | $324,729 | $486,010 |
| 2019 | $9,628 | $794,843 | $318,362 | $476,481 |
| 2018 | $9,506 | $779,259 | $312,120 | $467,139 |
| 2017 | $9,326 | $763,980 | $306,000 | $457,980 |
| 2016 | $9,188 | $749,000 | $300,000 | $449,000 |
| 2015 | $8,024 | $685,748 | $241,083 | $444,665 |
| 2014 | $7,812 | $664,020 | $233,100 | $430,920 |
Source: Public Records
Map
Nearby Homes
- 3476 Shelter Creek Dr
- 2090 Big Ranch Rd
- 111 Firefly Ln
- 4 Firefly Ln
- 89 Valley Club Cir
- 3202 Villa Ln
- 5 Blackberry Dr
- 67 Summerbrooke Cir
- 1198 Pear Tree Ln
- 3438 Willis Dr
- 3478 Willis Dr
- 339 Pear Tree Terrace Unit H
- 339 Pear Tree Terrace Unit C
- 2298 Vandeleur Dr
- 2274 Vandeleur Dr
- 3403 Willis Dr
- 3042 Beecham St
- 882 Professional Dr
- 79 Fountain Grove Cir
- 3429 Willis Dr
- 55 Catania Ln
- 47 Catania Ln
- 59 Catania Ln
- 54 Catania Ln
- 3494 Shelter Creek Dr
- 3496 Shelter Creek Dr
- 3490 Shelter Creek Dr
- 3488 Shelter Creek Dr Unit 1
- 3492 Shelter Creek Dr
- 3486 Shelter Creek Dr
- 63 Catania Ln
- 66 Catania Ln
- 3498 Shelter Creek Dr
- 3500 Shelter Creek Dr
- 3502 Shelter Creek Dr
- 3506 Shelter Creek Dr
- 3504 Shelter Creek Dr
- 72 Catania Ln
- 3484 Shelter Creek Dr Unit 1