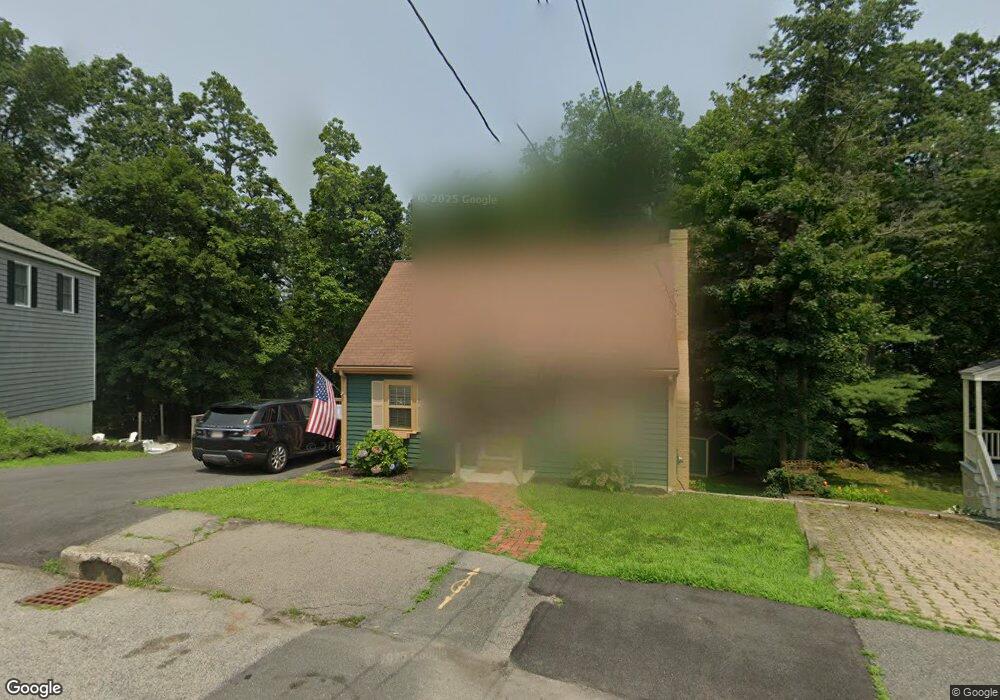
51 Judson Rd Weymouth, MA 02188
Weymouth Landing NeighborhoodEstimated Value: $550,000 - $590,539
3
Beds
2
Baths
1,078
Sq Ft
$535/Sq Ft
Est. Value
About This Home
This home is located at 51 Judson Rd, Weymouth, MA 02188 and is currently estimated at $576,385, approximately $534 per square foot. 51 Judson Rd is a home located in Norfolk County with nearby schools including Frederick C Murphy, Abigail Adams Middle School, and Weymouth Middle School Chapman.
Ownership History
Date
Name
Owned For
Owner Type
Purchase Details
Closed on
Jul 28, 2000
Sold by
Skeffington Claire
Bought by
Mccarthy Natalie
Current Estimated Value
Purchase Details
Closed on
Feb 7, 1989
Sold by
Thomas Stephen B
Bought by
Thomas Claire F
Create a Home Valuation Report for This Property
The Home Valuation Report is an in-depth analysis detailing your home's value as well as a comparison with similar homes in the area
Home Values in the Area
Average Home Value in this Area
Purchase History
| Date | Buyer | Sale Price | Title Company |
|---|---|---|---|
| Mccarthy Natalie | $189,000 | -- | |
| Thomas Claire F | $30,000 | -- |
Source: Public Records
Mortgage History
| Date | Status | Borrower | Loan Amount |
|---|---|---|---|
| Open | Thomas Claire F | $208,500 | |
| Closed | Thomas Claire F | $205,535 | |
| Closed | Thomas Claire F | $58,000 |
Source: Public Records
Tax History Compared to Growth
Tax History
| Year | Tax Paid | Tax Assessment Tax Assessment Total Assessment is a certain percentage of the fair market value that is determined by local assessors to be the total taxable value of land and additions on the property. | Land | Improvement |
|---|---|---|---|---|
| 2025 | $4,518 | $447,300 | $224,100 | $223,200 |
| 2024 | $4,376 | $426,100 | $213,400 | $212,700 |
| 2023 | $4,126 | $394,800 | $197,600 | $197,200 |
| 2022 | $4,049 | $353,300 | $183,000 | $170,300 |
| 2021 | $3,901 | $332,300 | $183,000 | $149,300 |
| 2020 | $3,782 | $317,300 | $183,000 | $134,300 |
| 2019 | $3,692 | $304,600 | $176,000 | $128,600 |
| 2018 | $3,586 | $286,900 | $167,600 | $119,300 |
| 2017 | $3,482 | $271,800 | $159,600 | $112,200 |
| 2016 | $3,347 | $261,500 | $153,500 | $108,000 |
| 2015 | $3,159 | $244,900 | $146,500 | $98,400 |
| 2014 | $3,002 | $225,700 | $136,300 | $89,400 |
Source: Public Records
Map
Nearby Homes
- 76 Kingman St
- 24 Blake Rd
- 15 Summer St
- 33 Congress St
- 16 Lindbergh Ave
- 23-25 Lindbergh Ave
- 11 Richmond St
- 114 Broad St Unit D
- 114 Broad St Unit C
- 122 Washington St Unit 22
- 19 Vine St Unit 3
- 19 Vine St Unit 1
- 36 Brookside Rd
- 37 Lantern Ln
- 230 Lisle St
- 97 Liberty St
- 51 Faxon St
- 141 Commercial St Unit 9
- 200 Justin Dr Unit 3
- 286 Broad St