Estimated Value: $723,940 - $782,000
3
Beds
2
Baths
1,154
Sq Ft
$652/Sq Ft
Est. Value
About This Home
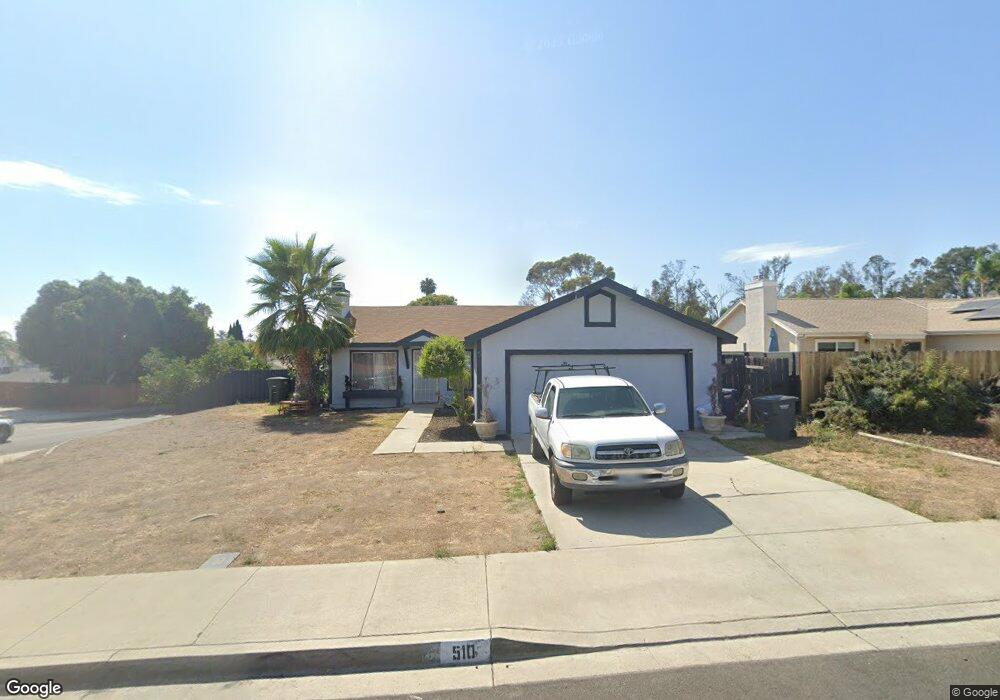
This home is located at 510 Hatherly St, Vista, CA 92083 and is currently estimated at $752,235, approximately $651 per square foot. 510 Hatherly St is a home located in San Diego County with nearby schools including Grapevine Elementary School, Madison Middle School, and Rancho Buena Vista High School.
Ownership History
Date
Name
Owned For
Owner Type
Purchase Details
Closed on
Sep 11, 2020
Sold by
Ruiz Alicia and Alicia Ruiz Revocable Living T
Bought by
Ruiz Alicia and Alicia Ruiz Revocable Living T
Current Estimated Value
Home Financials for this Owner
Home Financials are based on the most recent Mortgage that was taken out on this home.
Original Mortgage
$196,400
Outstanding Balance
$157,073
Interest Rate
2.8%
Mortgage Type
New Conventional
Estimated Equity
$595,162
Purchase Details
Closed on
Mar 18, 2017
Sold by
Ruiz Alicia
Bought by
Ruiz Alicia
Purchase Details
Closed on
Jul 2, 2013
Sold by
Longoria Sarah R
Bought by
Ruiz Alicia
Home Financials for this Owner
Home Financials are based on the most recent Mortgage that was taken out on this home.
Original Mortgage
$245,600
Interest Rate
3.92%
Mortgage Type
New Conventional
Purchase Details
Closed on
Mar 31, 2008
Sold by
Longoria Sarah R
Bought by
Longoria Sarah R
Purchase Details
Closed on
Nov 9, 1989
Bought by
Longoria Sarah R
Purchase Details
Closed on
Sep 26, 1988
Create a Home Valuation Report for This Property
The Home Valuation Report is an in-depth analysis detailing your home's value as well as a comparison with similar homes in the area
Home Values in the Area
Average Home Value in this Area
Purchase History
| Date | Buyer | Sale Price | Title Company |
|---|---|---|---|
| Ruiz Alicia | -- | Stewart Title Of Ca Inc | |
| Ruiz Alicia | -- | None Available | |
| Ruiz Alicia | $307,000 | First American Title | |
| Longoria Sarah R | -- | None Available | |
| Longoria Sarah R | $154,000 | -- | |
| -- | $110,900 | -- |
Source: Public Records
Mortgage History
| Date | Status | Borrower | Loan Amount |
|---|---|---|---|
| Open | Ruiz Alicia | $196,400 | |
| Closed | Ruiz Alicia | $245,600 |
Source: Public Records
Tax History Compared to Growth
Tax History
| Year | Tax Paid | Tax Assessment Tax Assessment Total Assessment is a certain percentage of the fair market value that is determined by local assessors to be the total taxable value of land and additions on the property. | Land | Improvement |
|---|---|---|---|---|
| 2025 | $4,789 | $376,327 | $245,166 | $131,161 |
| 2024 | $4,789 | $368,949 | $240,359 | $128,590 |
| 2023 | $4,692 | $361,716 | $235,647 | $126,069 |
| 2022 | $4,681 | $354,625 | $231,027 | $123,598 |
| 2021 | $4,580 | $347,673 | $226,498 | $121,175 |
| 2020 | $4,553 | $344,109 | $224,176 | $119,933 |
| 2019 | $4,490 | $337,363 | $219,781 | $117,582 |
| 2018 | $4,303 | $330,749 | $215,472 | $115,277 |
| 2017 | $120 | $324,265 | $211,248 | $113,017 |
| 2016 | $4,140 | $317,907 | $207,106 | $110,801 |
| 2015 | $4,116 | $313,133 | $203,996 | $109,137 |
| 2014 | $3,944 | $307,000 | $200,000 | $107,000 |
Source: Public Records
Map
Nearby Homes
- 1636 Jonathon St
- 320 Grapevine Rd Unit 9
- 523 Hatherly St
- 211 Silver Fir Ct
- 202 Bay Laurel Ct
- 374 Forest Place
- 2839 Emerald Dr
- 1414 Janis Lynn Ln
- 4228 Lewis St
- 323 Hill Dr
- 227 Hill Dr
- 233 Hill Dr
- 1713 Cameo Dr
- 4137 Alana Cir
- 4142 Galbar St
- 0 Galaxy Dr
- 1532 Olive Ave
- 000000 College Blvd
- 1338 Olive Ave
- 607 Via Del Mar
- 514 Hatherly St
- 505 Huff St
- 518 Hatherly St
- 1629 Jonathon St
- 513 Huff St
- 499 Huff St
- 1640 Jonathon St
- 1632 Jonathon St
- 511 Hatherly St
- 1628 Jonathon St
- 495 Huff St
- 519 Huff St
- 522 Hatherly St
- 1625 Jonathon St
- 515 Hatherly St
- 1624 Jonathon St
- 1629 Doris Jean Place
- 519 Hatherly St
- 1617 Doris Jean Place
- 366 Grapevine Rd