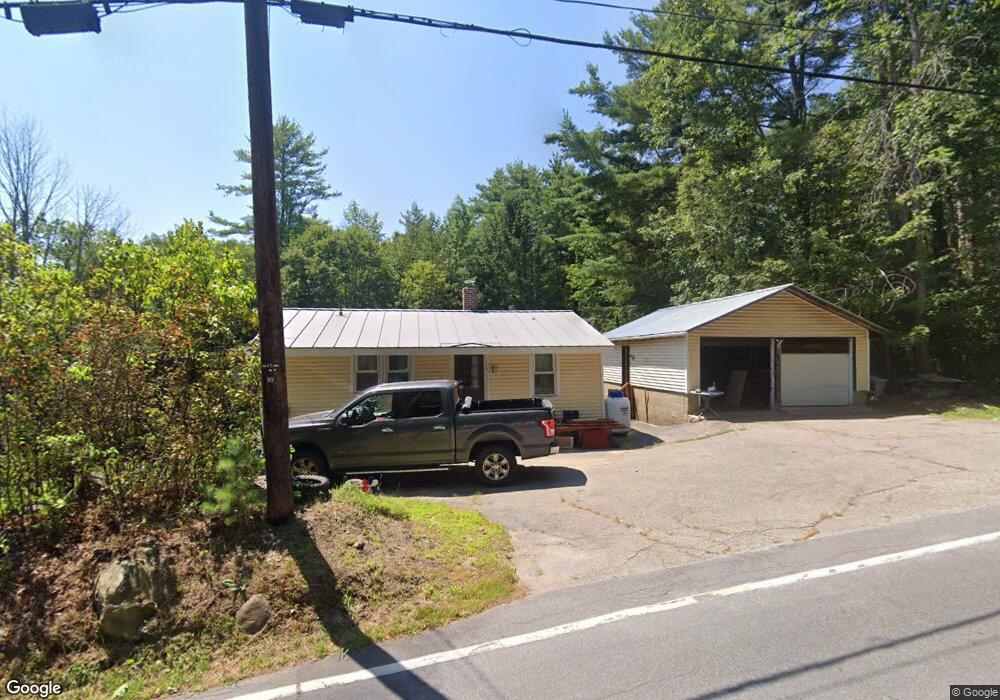
510 South Rd Salisbury, NH 03268
Estimated Value: $282,000 - $329,000
2
Beds
1
Bath
768
Sq Ft
$403/Sq Ft
Est. Value
About This Home
This home is located at 510 South Rd, Salisbury, NH 03268 and is currently estimated at $309,224, approximately $402 per square foot. 510 South Rd is a home located in Merrimack County with nearby schools including Salisbury Elementary School, Merrimack Valley Middle School, and Merrimack Valley High School.
Ownership History
Date
Name
Owned For
Owner Type
Purchase Details
Closed on
Dec 31, 2009
Sold by
Cld Asset Management L
Bought by
Frew Marcy A
Current Estimated Value
Home Financials for this Owner
Home Financials are based on the most recent Mortgage that was taken out on this home.
Original Mortgage
$101,938
Outstanding Balance
$66,049
Interest Rate
4.85%
Mortgage Type
Purchase Money Mortgage
Estimated Equity
$243,175
Purchase Details
Closed on
Aug 28, 2009
Sold by
1St Phoenix Resolut Ll
Bought by
Cld Asset Management L
Home Financials for this Owner
Home Financials are based on the most recent Mortgage that was taken out on this home.
Original Mortgage
$77,000
Interest Rate
5.17%
Mortgage Type
Purchase Money Mortgage
Purchase Details
Closed on
Mar 27, 2008
Sold by
Mussey Albert W and Wm Specialty Mortgage
Bought by
Wm Specialty Mortgage
Create a Home Valuation Report for This Property
The Home Valuation Report is an in-depth analysis detailing your home's value as well as a comparison with similar homes in the area
Home Values in the Area
Average Home Value in this Area
Purchase History
| Date | Buyer | Sale Price | Title Company |
|---|---|---|---|
| Frew Marcy A | $99,900 | -- | |
| Cld Asset Management L | $54,000 | -- | |
| 1St Phoenix Resolut Ll | $49,900 | -- | |
| Wm Specialty Mortgage | $116,700 | -- |
Source: Public Records
Mortgage History
| Date | Status | Borrower | Loan Amount |
|---|---|---|---|
| Open | Wm Specialty Mortgage | $101,938 | |
| Previous Owner | Wm Specialty Mortgage | $77,000 | |
| Previous Owner | Wm Specialty Mortgage | $8,000 |
Source: Public Records
Tax History Compared to Growth
Tax History
| Year | Tax Paid | Tax Assessment Tax Assessment Total Assessment is a certain percentage of the fair market value that is determined by local assessors to be the total taxable value of land and additions on the property. | Land | Improvement |
|---|---|---|---|---|
| 2024 | $3,829 | $236,200 | $81,200 | $155,000 |
| 2023 | $3,826 | $236,200 | $81,200 | $155,000 |
| 2022 | $3,770 | $236,200 | $81,200 | $155,000 |
| 2021 | $3,496 | $147,200 | $48,700 | $98,500 |
| 2020 | $3,621 | $147,200 | $48,700 | $98,500 |
| 2019 | $3,411 | $147,400 | $48,700 | $98,700 |
| 2018 | $3,429 | $147,400 | $48,700 | $98,700 |
| 2017 | $3,538 | $147,400 | $48,700 | $98,700 |
| 2016 | $3,068 | $124,900 | $41,500 | $83,400 |
| 2015 | $2,905 | $119,900 | $41,500 | $78,400 |
| 2014 | $2,794 | $119,900 | $41,500 | $78,400 |
| 2012 | $2,896 | $119,900 | $41,500 | $78,400 |
Source: Public Records
Map
Nearby Homes
- 231 Mutton Rd
- 233 Hensmith Rd
- 54 Franklin Rd
- 110 Pearson Hill Rd
- 437 High St
- 375 Franklin Rd
- 10 Call Rd
- 516 W Salisbury Rd
- 220 Couchtown Rd
- 7 Cashell Ln
- Map 6, Lot 38 Chadwick Hill Rd
- 526 Salisbury Rd
- 71 Old Pumpkin Hill Rd
- 428 North Rd
- 428 N Rd
- 122 Centennial Dr
- 0 Beech Hill Rd Unit 370 5046361
- 19 Bailey Dr
- 00 Smith Hill Rd Unit 401
- 222 Daniel Webster Hwy