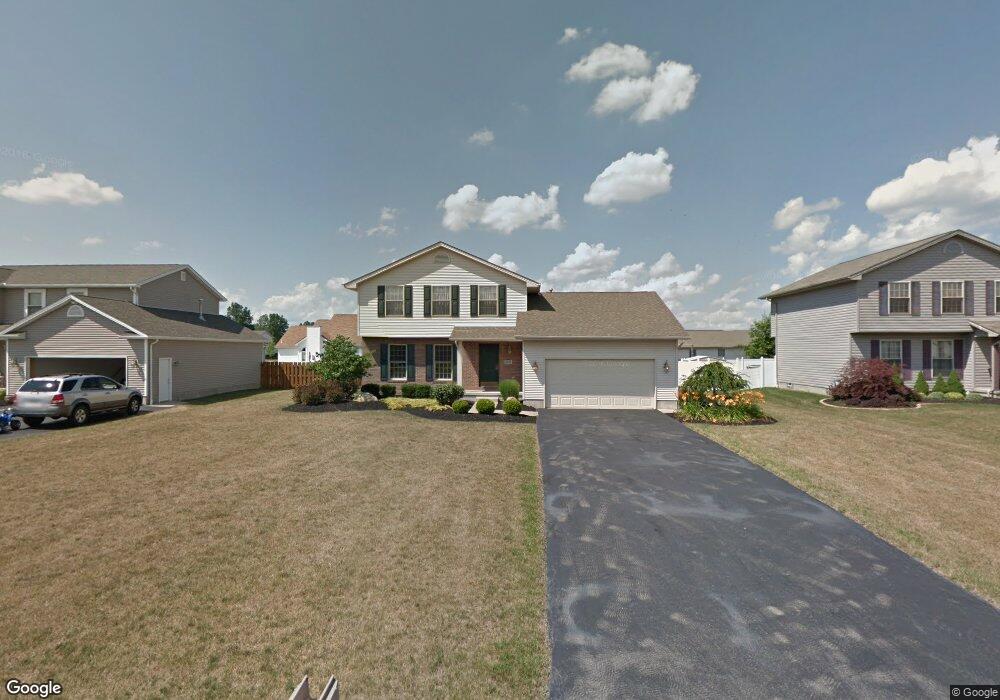
5100 Cranberry Dr Mineral Ridge, OH 44440
Austintown NeighborhoodEstimated Value: $287,000 - $312,000
3
Beds
3
Baths
1,882
Sq Ft
$157/Sq Ft
Est. Value
About This Home
This home is located at 5100 Cranberry Dr, Mineral Ridge, OH 44440 and is currently estimated at $295,219, approximately $156 per square foot. 5100 Cranberry Dr is a home located in Mahoning County with nearby schools including Austintown Elementary School, Austintown Intermediate School, and Austintown Middle School.
Ownership History
Date
Name
Owned For
Owner Type
Purchase Details
Closed on
Nov 7, 2011
Sold by
The Home Savings & Loan Company Of Young
Bought by
Ali Ahmed M
Current Estimated Value
Home Financials for this Owner
Home Financials are based on the most recent Mortgage that was taken out on this home.
Original Mortgage
$133,039
Outstanding Balance
$91,157
Interest Rate
4.12%
Mortgage Type
FHA
Estimated Equity
$204,062
Purchase Details
Closed on
Jun 2, 2011
Sold by
Bache Christopher
Bought by
The Home Savings & Loan Company Of Young
Purchase Details
Closed on
Aug 10, 2005
Sold by
Bertelli Homes Inc
Bought by
Bache Christopher and Bache Kathleen
Home Financials for this Owner
Home Financials are based on the most recent Mortgage that was taken out on this home.
Original Mortgage
$125,060
Interest Rate
5.5%
Mortgage Type
Fannie Mae Freddie Mac
Create a Home Valuation Report for This Property
The Home Valuation Report is an in-depth analysis detailing your home's value as well as a comparison with similar homes in the area
Home Values in the Area
Average Home Value in this Area
Purchase History
| Date | Buyer | Sale Price | Title Company |
|---|---|---|---|
| Ali Ahmed M | $136,500 | Attorney | |
| The Home Savings & Loan Company Of Young | $122,000 | Attorney | |
| Bache Christopher | $155,800 | -- |
Source: Public Records
Mortgage History
| Date | Status | Borrower | Loan Amount |
|---|---|---|---|
| Open | Ali Ahmed M | $133,039 | |
| Previous Owner | Bache Christopher | $125,060 | |
| Closed | Bache Christopher | $31,265 |
Source: Public Records
Tax History Compared to Growth
Tax History
| Year | Tax Paid | Tax Assessment Tax Assessment Total Assessment is a certain percentage of the fair market value that is determined by local assessors to be the total taxable value of land and additions on the property. | Land | Improvement |
|---|---|---|---|---|
| 2024 | $4,061 | $86,710 | $6,650 | $80,060 |
| 2023 | $3,785 | $82,080 | $6,650 | $75,430 |
| 2022 | $3,333 | $57,900 | $6,650 | $51,250 |
| 2021 | $3,335 | $57,900 | $6,650 | $51,250 |
| 2020 | $3,349 | $57,900 | $6,650 | $51,250 |
| 2019 | $3,276 | $51,610 | $6,650 | $44,960 |
| 2018 | $3,157 | $51,610 | $6,650 | $44,960 |
| 2017 | $3,149 | $51,610 | $6,650 | $44,960 |
| 2016 | $3,144 | $50,930 | $6,650 | $44,280 |
| 2015 | $3,050 | $50,930 | $6,650 | $44,280 |
| 2014 | $3,065 | $50,930 | $6,650 | $44,280 |
| 2013 | $3,034 | $50,930 | $6,650 | $44,280 |
Source: Public Records
Map
Nearby Homes
- 5085 Winslow Dr
- 1239 Woodledge Dr
- 0 W Webb Rd
- 1467 E County Line Rd
- 21 E Liberty St
- 1684 Morris St
- 1445 E County Line Rd
- 645 Carlin Dr
- 3872 Main St
- 3907 Edwards St
- 3579 Bee St
- 2169 Salt Springs Rd
- 0 W Liberty Unit 5153649
- 5231 W Rockwell Rd
- 6360 Meander Glen Dr
- 4028 Lanterman Rd
- 4020 Lanterman Rd
- 3474 S Main St
- 6393 Meander Glen Dr
- 176 N Canfield Niles Rd
- 5104 Cranberry Dr
- 5096 Cranberry Dr
- 5097 Winslow Dr
- 5092 Cranberry Dr
- 5101 Winslow Dr
- 5093 Winslow Dr
- 5108 Cranberry Dr
- 5099 Cranberry Dr
- 5105 Winslow Dr
- 5089 Winslow Dr
- 5095 Cranberry Dr
- 5103 Cranberry Dr
- 5088 Cranberry Dr
- 5091 Cranberry Dr
- 5109 Winslow Dr
- 5112 Cranberry Dr
- 5087 Cranberry Dr
- 5116 Cranberry Dr
- 5115 Cranberry Dr
- 5098 Winslow Dr