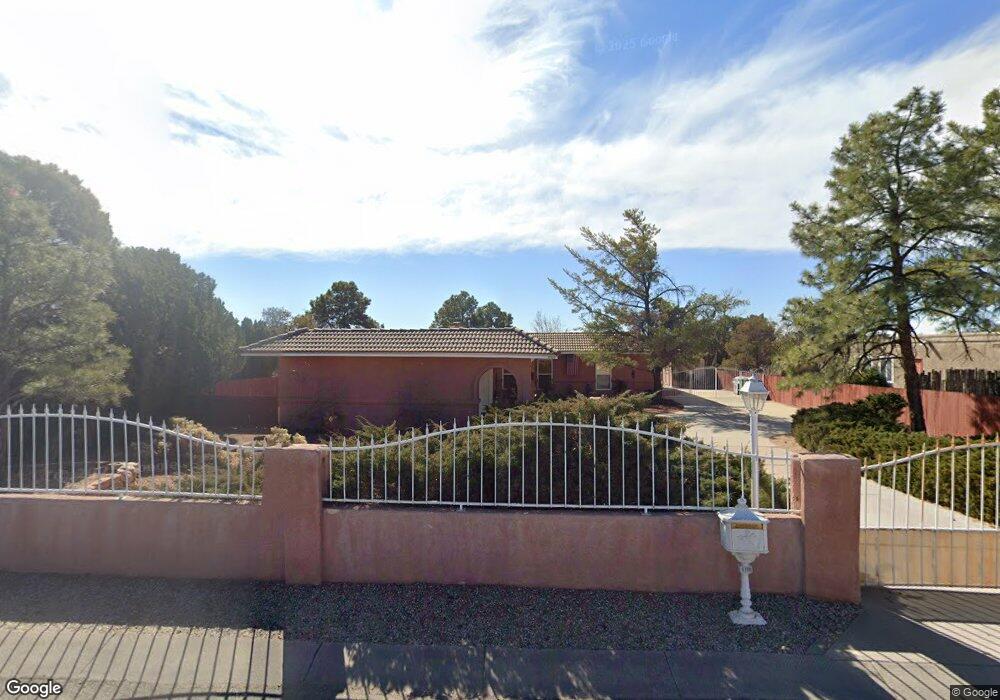
5100 Russell Dr NW Albuquerque, NM 87114
Paradise Hills Civic NeighborhoodEstimated Value: $383,000 - $533,000
4
Beds
2
Baths
2,215
Sq Ft
$195/Sq Ft
Est. Value
About This Home
This home is located at 5100 Russell Dr NW, Albuquerque, NM 87114 and is currently estimated at $432,177, approximately $195 per square foot. 5100 Russell Dr NW is a home located in Bernalillo County with nearby schools including Sierra Vista Elementary School, James Monroe Middle School, and Cibola High School.
Ownership History
Date
Name
Owned For
Owner Type
Purchase Details
Closed on
Jul 30, 2008
Sold by
Waythomas Peter D and Waythomas Laura M
Bought by
White Kenneth B and White Sharon R
Current Estimated Value
Home Financials for this Owner
Home Financials are based on the most recent Mortgage that was taken out on this home.
Original Mortgage
$231,200
Outstanding Balance
$151,629
Interest Rate
6.4%
Mortgage Type
Purchase Money Mortgage
Estimated Equity
$280,548
Purchase Details
Closed on
Jan 3, 2008
Sold by
George Robert L and George Sandra K
Bought by
Waythomas Peter D and Waythomas Laura M
Home Financials for this Owner
Home Financials are based on the most recent Mortgage that was taken out on this home.
Original Mortgage
$140,350
Interest Rate
5.88%
Mortgage Type
Purchase Money Mortgage
Purchase Details
Closed on
Jul 30, 1994
Sold by
Franchino Daniel
Bought by
George Robert L and George Sandra K
Home Financials for this Owner
Home Financials are based on the most recent Mortgage that was taken out on this home.
Original Mortgage
$132,000
Interest Rate
6.92%
Mortgage Type
Assumption
Create a Home Valuation Report for This Property
The Home Valuation Report is an in-depth analysis detailing your home's value as well as a comparison with similar homes in the area
Home Values in the Area
Average Home Value in this Area
Purchase History
| Date | Buyer | Sale Price | Title Company |
|---|---|---|---|
| White Kenneth B | -- | Stewart Title | |
| Waythomas Peter D | -- | Stewart Title | |
| George Robert L | -- | Alb Title |
Source: Public Records
Mortgage History
| Date | Status | Borrower | Loan Amount |
|---|---|---|---|
| Open | White Kenneth B | $231,200 | |
| Previous Owner | Waythomas Peter D | $140,350 | |
| Previous Owner | George Robert L | $132,000 |
Source: Public Records
Tax History Compared to Growth
Tax History
| Year | Tax Paid | Tax Assessment Tax Assessment Total Assessment is a certain percentage of the fair market value that is determined by local assessors to be the total taxable value of land and additions on the property. | Land | Improvement |
|---|---|---|---|---|
| 2025 | $2,026 | $73,397 | $19,215 | $54,182 |
| 2024 | $2,026 | $71,259 | $18,655 | $52,604 |
| 2023 | $1,989 | $69,184 | $18,112 | $51,072 |
| 2022 | $1,916 | $67,169 | $17,585 | $49,584 |
| 2021 | $1,846 | $65,213 | $17,073 | $48,140 |
| 2020 | $1,811 | $63,314 | $16,576 | $46,738 |
| 2019 | $1,753 | $61,470 | $16,093 | $45,377 |
| 2018 | $1,684 | $61,470 | $16,093 | $45,377 |
| 2017 | $1,626 | $59,681 | $15,625 | $44,056 |
| 2016 | $1,757 | $56,255 | $14,728 | $41,527 |
| 2015 | $54,617 | $54,617 | $14,299 | $40,318 |
| 2014 | $1,643 | $53,027 | $13,883 | $39,144 |
| 2013 | -- | $51,483 | $13,479 | $38,004 |
Source: Public Records
Map
Nearby Homes
- 5207 Russell Dr NW
- 5001 Justin Dr NW
- 9922 Columbus Cir NW
- 10012 Club Ct NW
- 4923 Alta Mesa NW
- 9669 Asbury Ln NW
- 10305 Timan Place NW
- 4713 Country Club Ln NW Unit D4
- 4703 Country Club Ln NW Unit H1
- 5512 Fordham Dr NW
- Catalina Plan at Estates at Academy
- 9232 Jill Patricia St NW
- 9958 Golf Course Rd NW
- 9924 Golf Course Rd NW
- 4801 Irving Blvd NW Unit 2802
- 4801 Irving Blvd NW Unit 802
- 4801 Irving Blvd NW Unit 2401
- 9323 Seneca Dr NW
- 9838 Academy St NW
- 9632 Jacks Creek Dr NW
- 5104 Russell Dr NW
- 5052 Russell Dr NW
- 5044 Martin Place NW
- 5108 Russell Dr NW
- 5043 Martin Place NW
- 5048 Russell Dr NW
- 5119 Russell Dr NW
- 5115 Lee Place NW
- 5024 Martin Place NW
- 5125 Russell Dr NW
- 5112 Russell Dr NW
- 5113 Simon Dr NW
- 5131 Russell Dr NW
- 5042 Martin Place NW
- 5044 Russell Dr NW
- 5107 Russell Dr NW
- 5022 Nelson Place NW
- 5116 Russell Dr NW
- 5023 Nelson Place NW
- 5112 Justin Dr NW