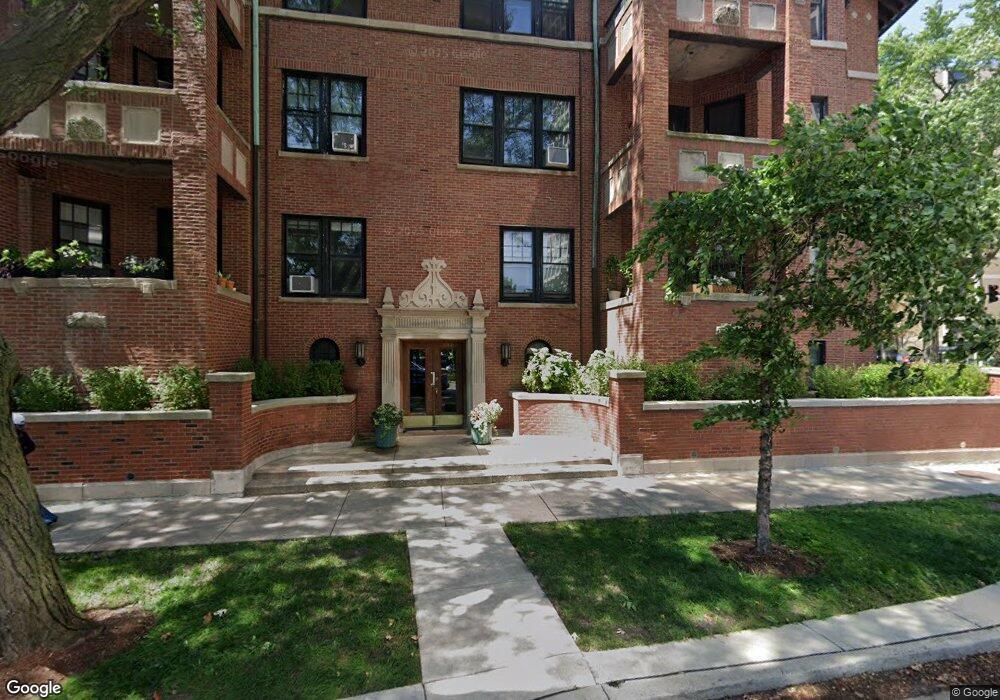
5100 S Hyde Park Blvd Unit 5100 Chicago, IL 60615
Hyde Park NeighborhoodEstimated Value: $203,000 - $317,000
--
Bed
--
Bath
--
Sq Ft
1.01
Acres
About This Home
This home is located at 5100 S Hyde Park Blvd Unit 5100, Chicago, IL 60615 and is currently estimated at $245,589. 5100 S Hyde Park Blvd Unit 5100 is a home located in Cook County with nearby schools including Harte Elementary School, Kenwood Academy High School, and Akiba-Schechter Jewish Day School.
Ownership History
Date
Name
Owned For
Owner Type
Purchase Details
Closed on
May 29, 2013
Sold by
Turpin Steve W
Bought by
Bakaitis Vyt and Bakaitis Elena F
Current Estimated Value
Home Financials for this Owner
Home Financials are based on the most recent Mortgage that was taken out on this home.
Original Mortgage
$76,500
Outstanding Balance
$54,053
Interest Rate
3.34%
Mortgage Type
New Conventional
Estimated Equity
$191,536
Purchase Details
Closed on
Sep 12, 2003
Sold by
Nasra Hassan Mahir F and Nasra Hassan
Bought by
Turpin Sten W
Home Financials for this Owner
Home Financials are based on the most recent Mortgage that was taken out on this home.
Original Mortgage
$125,150
Interest Rate
6.4%
Mortgage Type
Stand Alone First
Purchase Details
Closed on
May 6, 1995
Sold by
Johnson Stephanie Elisa
Bought by
Hassan Mahir F
Home Financials for this Owner
Home Financials are based on the most recent Mortgage that was taken out on this home.
Original Mortgage
$83,400
Interest Rate
8.42%
Create a Home Valuation Report for This Property
The Home Valuation Report is an in-depth analysis detailing your home's value as well as a comparison with similar homes in the area
Home Values in the Area
Average Home Value in this Area
Purchase History
| Date | Buyer | Sale Price | Title Company |
|---|---|---|---|
| Bakaitis Vyt | $153,000 | None Available | |
| Turpin Sten W | $156,000 | Pntn | |
| Hassan Mahir F | $86,000 | -- |
Source: Public Records
Mortgage History
| Date | Status | Borrower | Loan Amount |
|---|---|---|---|
| Open | Bakaitis Vyt | $76,500 | |
| Previous Owner | Turpin Sten W | $125,150 | |
| Previous Owner | Hassan Mahir F | $83,400 | |
| Closed | Turpin Sten W | $31,090 |
Source: Public Records
Tax History Compared to Growth
Tax History
| Year | Tax Paid | Tax Assessment Tax Assessment Total Assessment is a certain percentage of the fair market value that is determined by local assessors to be the total taxable value of land and additions on the property. | Land | Improvement |
|---|---|---|---|---|
| 2024 | $3,811 | $20,571 | $5,002 | $15,569 |
| 2023 | $3,702 | $18,000 | $4,034 | $13,966 |
| 2022 | $3,702 | $18,000 | $4,034 | $13,966 |
| 2021 | $3,619 | $17,999 | $4,033 | $13,966 |
| 2020 | $2,786 | $12,953 | $3,226 | $9,727 |
| 2019 | $2,834 | $14,104 | $3,226 | $10,878 |
| 2018 | $2,786 | $14,104 | $3,226 | $10,878 |
| 2017 | $2,568 | $11,931 | $2,662 | $9,269 |
| 2016 | $2,390 | $11,931 | $2,662 | $9,269 |
| 2015 | $2,186 | $11,931 | $2,662 | $9,269 |
| 2014 | $2,722 | $14,673 | $2,178 | $12,495 |
| 2013 | $2,190 | $14,673 | $2,178 | $12,495 |
Source: Public Records
Map
Nearby Homes
- 1615 E Hyde Park Blvd Unit 2
- 5100 S Hyde Park Blvd Unit 1B
- 5050 S East End Ave Unit 4B
- 5050 S East End Ave Unit 7A
- 5050 S East End Ave Unit 2D
- 5050 S East End Ave Unit 7D
- 5201 S Cornell Ave Unit 27D
- 5201 S Cornell Ave Unit 20E
- 5201 S Cornell Ave Unit 4B
- 5000 S East End Ave Unit 18C
- 5000 S East End Ave Unit 2D
- 5000 S East End Ave Unit 13A
- 5000 S East End Ave Unit 24A
- 5000 S East End Ave Unit 23A
- 5000 S Cornell Ave Unit 3A
- 5000 S Cornell Ave Unit 6C
- 1640 E 50th St Unit 13B
- 4940 S East End Ave Unit 2C
- 5300 S Shore Dr Unit 111
- 5300 S Shore Dr Unit 59
- 1627 E Hyde Park Blvd Unit 3
- 1615 E Hyde Park Blvd Unit 3
- 5100 S Hyde Park Blvd Unit G
- 5100 S Hyde Park Blvd Unit 5100
- 5100 S Hyde Park Blvd Unit 5100
- 5100 S Hyde Park Blvd Unit 5100
- 5100 S Hyde Park Blvd Unit 1617
- 5100 S Hyde Park Blvd Unit 5100
- 5100 S Hyde Park Blvd Unit 1621
- 5100 S Hyde Park Blvd Unit 1627
- 5100 S Hyde Park Blvd Unit 1635
- 1629 E Hyde Park Blvd Unit 1629
- 5100 S Hyde Park Blvd Unit 1627
- 1615 E Hyde Park Blvd Unit 1615
- 5100 S Hyde Park Blvd Unit 5109
- 5100 S Hyde Park Blvd Unit 5100
- 5100 S Hyde Park Blvd Unit 5100
- 1629 E Hyde Park Blvd Unit 1629
- 5100 S Hyde Park Blvd Unit 5100
- 1615 E Hyde Park Blvd Unit 1615