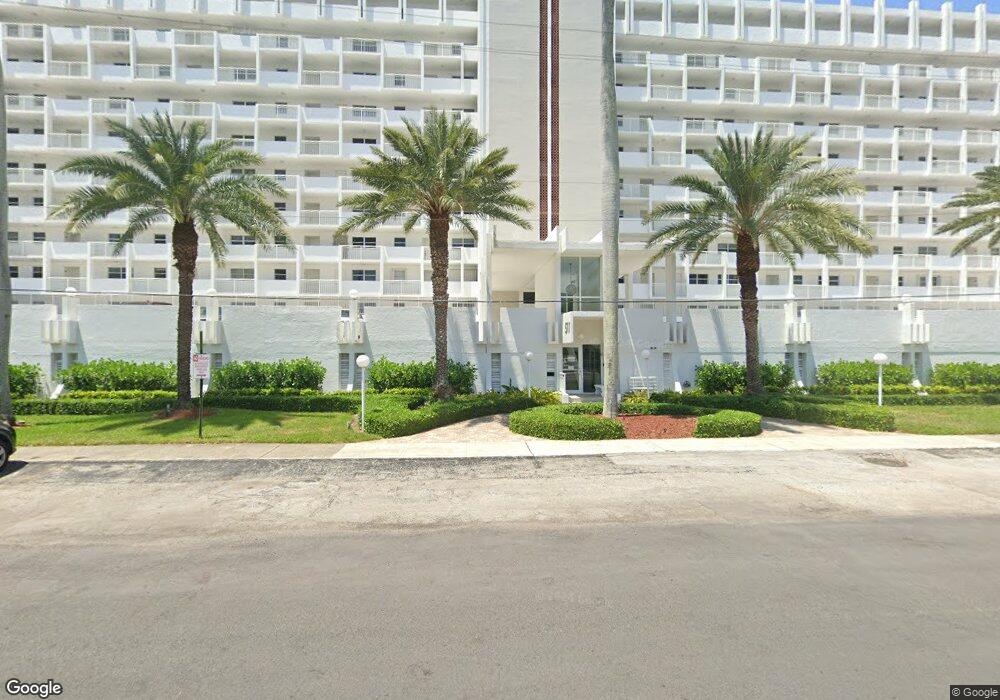
Bayshore Towers 511 Bayshore Dr Fort Lauderdale, FL 33304
Central Beach NeighborhoodEstimated Value: $700,000 - $885,000
3
Beds
2
Baths
1,330
Sq Ft
$595/Sq Ft
Est. Value
About This Home
This home is located at 511 Bayshore Dr, Fort Lauderdale, FL 33304 and is currently estimated at $791,874, approximately $595 per square foot. 511 Bayshore Dr is a home located in Broward County with nearby schools including Harbordale Elementary School, Sunrise Middle School, and Fort Lauderdale High School.
Ownership History
Date
Name
Owned For
Owner Type
Purchase Details
Closed on
Apr 4, 2025
Sold by
Gratt Jason Adam
Bought by
Gratt Jason Adam and Lovell Ryan Allen
Current Estimated Value
Purchase Details
Closed on
May 17, 2024
Sold by
Jannaccio Bruce
Bought by
Munley Robert W and Munley Lora Ann
Purchase Details
Closed on
Jan 10, 2024
Sold by
Dell-Arena Nicholas
Bought by
Stone Milton Francis and Shoaf Rick Allen
Purchase Details
Closed on
May 5, 2023
Sold by
Kenneth J Bergin Revocable Trust
Bought by
Gratt Jason A
Purchase Details
Closed on
Feb 22, 2016
Sold by
Mckain Douglas Richard
Bought by
Bergin Kenneth J
Purchase Details
Closed on
Jun 10, 2015
Sold by
Mckain Virginia M
Bought by
Mckain Virginia M
Purchase Details
Closed on
Mar 15, 1996
Sold by
Mckain Billy E and Mckain Virginia M
Bought by
Mckain Virginia M
Create a Home Valuation Report for This Property
The Home Valuation Report is an in-depth analysis detailing your home's value as well as a comparison with similar homes in the area
Home Values in the Area
Average Home Value in this Area
Purchase History
| Date | Buyer | Sale Price | Title Company |
|---|---|---|---|
| Gratt Jason Adam | -- | None Listed On Document | |
| Munley Robert W | $720,000 | Worldwide Title Escrow & Closi | |
| Stone Milton Francis | $530,000 | Lg Title & Escorw Llc | |
| Gratt Jason A | $975,000 | Sunbelt Title | |
| Bergin Kenneth J | $429,000 | Professional Title Associate | |
| Mckain Virginia M | -- | Attorney | |
| Mckain Virginia M | $100 | -- |
Source: Public Records
Tax History Compared to Growth
Tax History
| Year | Tax Paid | Tax Assessment Tax Assessment Total Assessment is a certain percentage of the fair market value that is determined by local assessors to be the total taxable value of land and additions on the property. | Land | Improvement |
|---|---|---|---|---|
| 2025 | $15,612 | $749,200 | $74,920 | $674,280 |
| 2024 | $4,968 | $861,990 | $86,200 | $775,790 |
| 2023 | $4,968 | $284,240 | $0 | $0 |
| 2022 | $4,712 | $275,970 | $0 | $0 |
| 2021 | $4,567 | $267,940 | $0 | $0 |
| 2020 | $4,478 | $264,250 | $0 | $0 |
| 2019 | $4,351 | $258,310 | $0 | $0 |
| 2018 | $4,111 | $253,500 | $0 | $0 |
| 2017 | $4,083 | $248,290 | $0 | $0 |
| 2016 | $7,391 | $374,500 | $0 | $0 |
| 2015 | $2,357 | $149,440 | $0 | $0 |
| 2014 | $2,374 | $148,260 | $0 | $0 |
| 2013 | -- | $319,040 | $31,900 | $287,140 |
Source: Public Records
About Bayshore Towers
Map
Nearby Homes
- 511 Bayshore Dr Unit 504
- 511 Bayshore Dr Unit 410
- 511 Bayshore Dr Unit 304
- 511 Bayshore Dr Unit 501
- 508 Antioch Ave Unit 7
- 550 Bayshore Dr Unit 506
- 550 Bayshore Dr Unit 102
- 527 Orton Ave Unit 302B
- 527 Orton Ave Unit 303 D
- 527 Orton Ave Unit 402B
- 527 Orton Ave Unit 603 C
- 527 Orton Ave Unit 701A
- 527 Orton Ave Unit 902B
- 527 Orton Ave Unit 903C
- 435 Bayshore Dr Unit 302
- 435 Bayshore Dr Unit 703
- 435 Bayshore Dr Unit 702
- 561 Bayshore Dr Unit 1
- 425 Bayshore Dr Unit 3
- 520 Orton Ave Unit 303
- 511 Bayshore Dr Unit 1
- 511 Bayshore Dr Unit 2
- 511 Bayshore Dr Unit 5
- 511 Bayshore Dr
- 511 Bayshore Dr Unit PH8
- 511 Bayshore Dr Unit PH-6
- 511 Bayshore Dr
- 511 Bayshore Dr
- 511 Bayshore Dr
- 511 Bayshore Dr
- 511 Bayshore Dr
- 511 Bayshore Dr
- 511 Bayshore Dr
- 511 Bayshore Dr
- 511 Bayshore Dr
- 511 Bayshore Dr
- 511 Bayshore Dr Unit 205
- 511 Bayshore Dr Unit 204
- 511 Bayshore Dr Unit 710
- 511 Bayshore Dr Unit 605