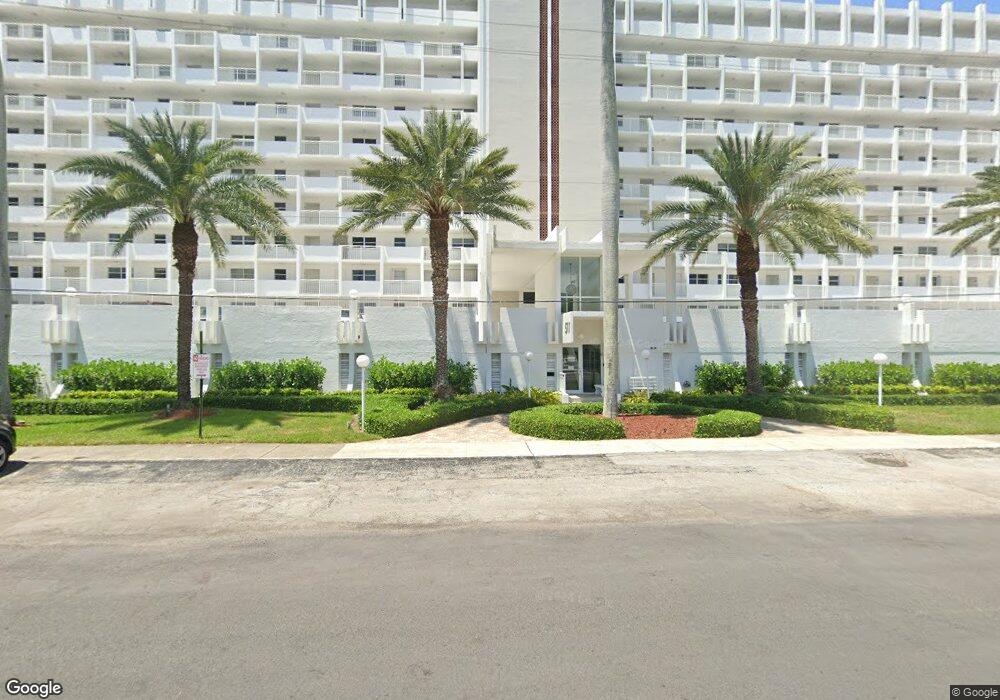
Bayshore Towers 511 Bayshore Dr Fort Lauderdale, FL 33304
Central Beach NeighborhoodEstimated Value: $699,000 - $782,641
3
Beds
2
Baths
1,330
Sq Ft
$566/Sq Ft
Est. Value
About This Home
This home is located at 511 Bayshore Dr, Fort Lauderdale, FL 33304 and is currently estimated at $752,410, approximately $565 per square foot. 511 Bayshore Dr is a home located in Broward County with nearby schools including Harbordale Elementary School, Sunrise Middle School, and Fort Lauderdale High School.
Ownership History
Date
Name
Owned For
Owner Type
Purchase Details
Closed on
Apr 17, 2025
Sold by
Fuschino Nicholas and Demichele Vincent
Bought by
Wehbe Ulla
Current Estimated Value
Purchase Details
Closed on
Jun 23, 2020
Sold by
Becker Velma
Bought by
Fuschino Nicholas and Demichele Vincent
Home Financials for this Owner
Home Financials are based on the most recent Mortgage that was taken out on this home.
Original Mortgage
$300,000
Interest Rate
3.2%
Mortgage Type
New Conventional
Purchase Details
Closed on
Dec 4, 1996
Sold by
Russell Raymond W
Bought by
Becker Raymond and Becker Velma
Home Financials for this Owner
Home Financials are based on the most recent Mortgage that was taken out on this home.
Original Mortgage
$100,000
Interest Rate
7.83%
Mortgage Type
New Conventional
Purchase Details
Closed on
Nov 1, 1981
Sold by
Available Not
Bought by
Available Not
Create a Home Valuation Report for This Property
The Home Valuation Report is an in-depth analysis detailing your home's value as well as a comparison with similar homes in the area
Home Values in the Area
Average Home Value in this Area
Purchase History
| Date | Buyer | Sale Price | Title Company |
|---|---|---|---|
| Wehbe Ulla | $810,000 | None Listed On Document | |
| Fuschino Nicholas | $500,000 | Attorney | |
| Becker Raymond | $175,000 | -- | |
| Available Not | $96,429 | -- |
Source: Public Records
Mortgage History
| Date | Status | Borrower | Loan Amount |
|---|---|---|---|
| Previous Owner | Fuschino Nicholas | $300,000 | |
| Previous Owner | Becker Raymond | $100,000 |
Source: Public Records
Tax History Compared to Growth
Tax History
| Year | Tax Paid | Tax Assessment Tax Assessment Total Assessment is a certain percentage of the fair market value that is determined by local assessors to be the total taxable value of land and additions on the property. | Land | Improvement |
|---|---|---|---|---|
| 2025 | $12,838 | $692,180 | -- | -- |
| 2024 | $11,844 | $692,180 | -- | -- |
| 2023 | $11,844 | $572,060 | $0 | $0 |
| 2022 | $10,007 | $520,060 | $52,010 | $468,050 |
| 2021 | $9,294 | $481,530 | $48,150 | $433,380 |
| 2020 | $9,048 | $470,730 | $47,070 | $423,660 |
| 2019 | $8,264 | $427,940 | $42,790 | $385,150 |
| 2018 | $8,020 | $427,660 | $42,770 | $384,890 |
| 2017 | $8,028 | $411,950 | $0 | $0 |
| 2016 | $7,391 | $374,500 | $0 | $0 |
| 2015 | $7,983 | $386,030 | $0 | $0 |
| 2014 | $7,420 | $350,940 | $0 | $0 |
| 2013 | -- | $319,040 | $31,900 | $287,140 |
Source: Public Records
About Bayshore Towers
Map
Nearby Homes
- 511 Bayshore Dr Unit 504
- 511 Bayshore Dr Unit 410
- 511 Bayshore Dr Unit 304
- 511 Bayshore Dr Unit 501
- 508 Antioch Ave Unit 7
- 550 Bayshore Dr Unit 506
- 550 Bayshore Dr Unit 102
- 527 Orton Ave Unit 302B
- 527 Orton Ave Unit 303 D
- 527 Orton Ave Unit 402B
- 527 Orton Ave Unit 603 C
- 527 Orton Ave Unit 701A
- 527 Orton Ave Unit 902B
- 527 Orton Ave Unit 903C
- 435 Bayshore Dr Unit 302
- 435 Bayshore Dr Unit 703
- 435 Bayshore Dr Unit 702
- 561 Bayshore Dr Unit 1
- 425 Bayshore Dr Unit 3
- 520 Orton Ave Unit 303
- 511 Bayshore Dr Unit 1
- 511 Bayshore Dr Unit 2
- 511 Bayshore Dr Unit 5
- 511 Bayshore Dr
- 511 Bayshore Dr Unit PH8
- 511 Bayshore Dr Unit PH-6
- 511 Bayshore Dr
- 511 Bayshore Dr
- 511 Bayshore Dr
- 511 Bayshore Dr
- 511 Bayshore Dr
- 511 Bayshore Dr
- 511 Bayshore Dr
- 511 Bayshore Dr
- 511 Bayshore Dr
- 511 Bayshore Dr
- 511 Bayshore Dr Unit 205
- 511 Bayshore Dr Unit 204
- 511 Bayshore Dr Unit 710
- 511 Bayshore Dr Unit 605