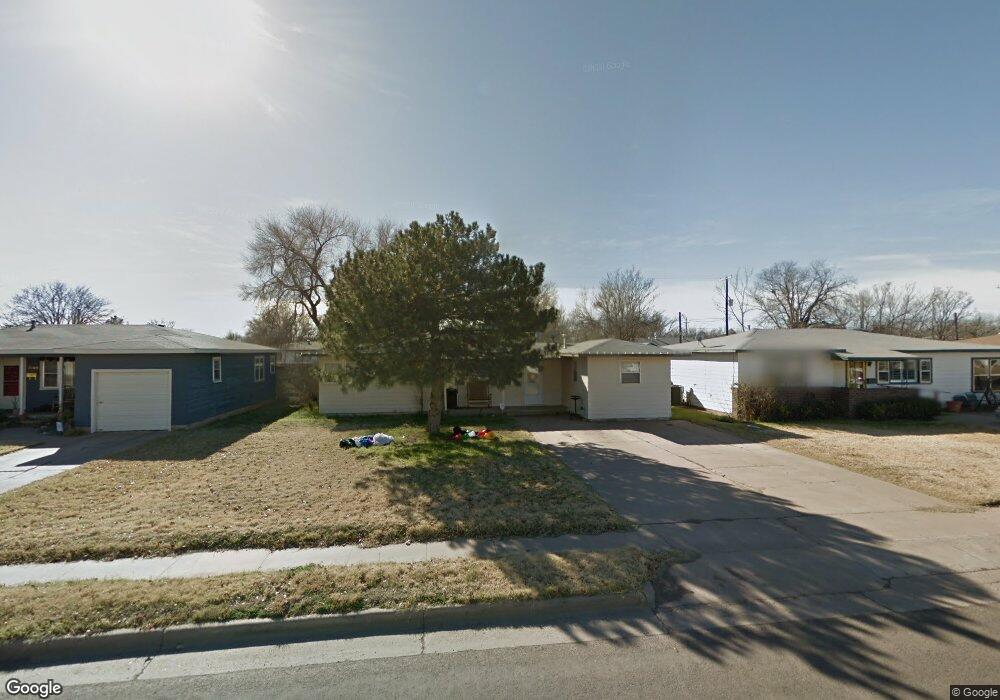
5111 41st St Lubbock, TX 79414
Stubbs-Stewart NeighborhoodEstimated Value: $142,483 - $145,000
3
Beds
2
Baths
1,434
Sq Ft
$100/Sq Ft
Est. Value
About This Home
This home is located at 5111 41st St, Lubbock, TX 79414 and is currently estimated at $143,621, approximately $100 per square foot. 5111 41st St is a home located in Lubbock County with nearby schools including Stewart Elementary School, Commander William C. McCool Academy, and Irons Middle School.
Ownership History
Date
Name
Owned For
Owner Type
Purchase Details
Closed on
Oct 7, 2021
Sold by
Parker Vickie L
Bought by
Windrem Hillary and Windrem James
Current Estimated Value
Home Financials for this Owner
Home Financials are based on the most recent Mortgage that was taken out on this home.
Original Mortgage
$95,200
Outstanding Balance
$86,814
Interest Rate
2.8%
Mortgage Type
New Conventional
Estimated Equity
$56,807
Purchase Details
Closed on
Mar 20, 2015
Sold by
Prock Sherry Gale and Fox Debara Kay
Bought by
Parker Vickie L
Home Financials for this Owner
Home Financials are based on the most recent Mortgage that was taken out on this home.
Original Mortgage
$76,587
Interest Rate
4.4%
Mortgage Type
FHA
Purchase Details
Closed on
Jul 22, 2014
Sold by
Estate Of Doris Faye Manley and Prock Sherry
Bought by
Prock Sherry Gale and Fox Debara Kay
Purchase Details
Closed on
Nov 21, 2013
Sold by
Manley Charles Dean
Bought by
Manley Doris Faye
Purchase Details
Closed on
Oct 6, 2008
Sold by
Manley Doris Faye
Bought by
Parker Vickie L
Create a Home Valuation Report for This Property
The Home Valuation Report is an in-depth analysis detailing your home's value as well as a comparison with similar homes in the area
Home Values in the Area
Average Home Value in this Area
Purchase History
| Date | Buyer | Sale Price | Title Company |
|---|---|---|---|
| Windrem Hillary | -- | Hub City Title | |
| Windrem Hillary | -- | Hub City Title | |
| Parker Vickie L | -- | Service Title | |
| Prock Sherry Gale | -- | None Available | |
| Manley Doris Faye | -- | None Available | |
| Parker Vickie L | -- | -- |
Source: Public Records
Mortgage History
| Date | Status | Borrower | Loan Amount |
|---|---|---|---|
| Open | Windrem Hillary | $95,200 | |
| Closed | Windrem Hillary | $92,000 | |
| Previous Owner | Parker Vickie L | $76,587 |
Source: Public Records
Tax History Compared to Growth
Tax History
| Year | Tax Paid | Tax Assessment Tax Assessment Total Assessment is a certain percentage of the fair market value that is determined by local assessors to be the total taxable value of land and additions on the property. | Land | Improvement |
|---|---|---|---|---|
| 2025 | $1,825 | $120,576 | $19,255 | $101,321 |
| 2024 | $1,825 | $100,480 | $22,000 | $78,480 |
| 2023 | $2,098 | $112,889 | $8,640 | $104,249 |
| 2022 | $2,036 | $100,590 | $8,640 | $91,950 |
| 2021 | $1,793 | $83,712 | $8,640 | $75,072 |
| 2020 | $1,745 | $80,240 | $8,640 | $71,600 |
| 2019 | $1,638 | $72,945 | $8,640 | $64,305 |
| 2018 | $1,491 | $66,314 | $8,640 | $57,674 |
| 2017 | $1,357 | $60,285 | $8,640 | $51,645 |
| 2016 | $1,357 | $60,285 | $8,640 | $51,645 |
| 2015 | $1,458 | $58,627 | $8,640 | $49,987 |
| 2014 | $1,458 | $65,550 | $3,900 | $61,650 |
Source: Public Records
Map
Nearby Homes