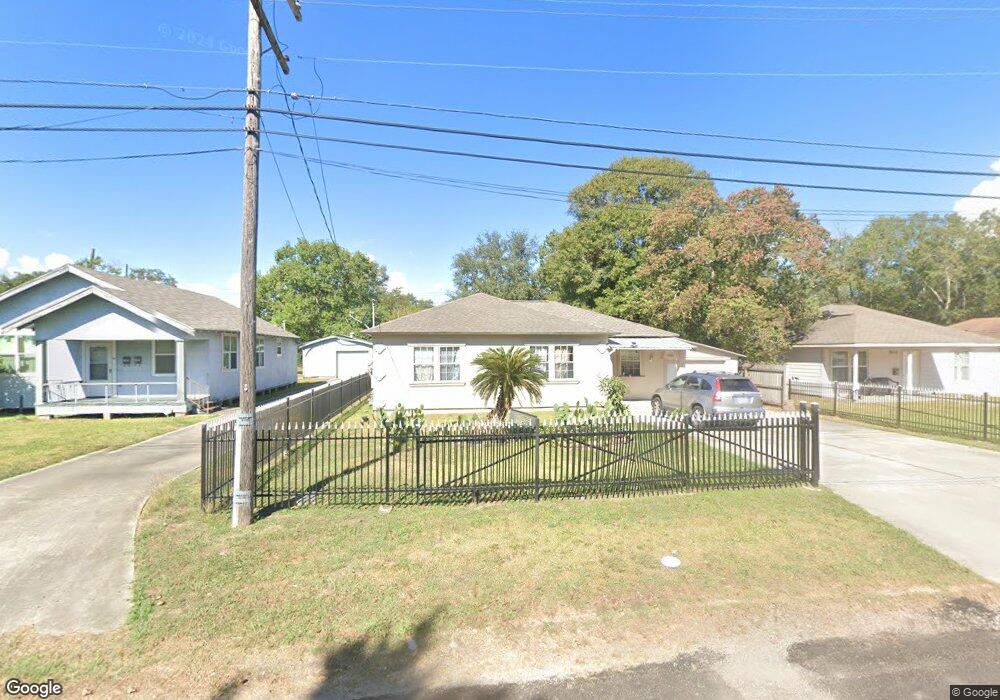
5111 7th St Port Arthur, TX 77642
Estimated Value: $81,000 - $105,000
--
Bed
--
Bath
1,364
Sq Ft
$70/Sq Ft
Est. Value
About This Home
This home is located at 5111 7th St, Port Arthur, TX 77642 and is currently estimated at $94,900, approximately $69 per square foot. 5111 7th St is a home located in Jefferson County with nearby schools including Travis Elementary School, Jefferson Middle School, and Memorial High School.
Ownership History
Date
Name
Owned For
Owner Type
Purchase Details
Closed on
May 27, 2025
Sold by
Sanchez Jose Luis
Bought by
Sanchez Alvaro Angel and Herrera Maria Sanchez
Current Estimated Value
Purchase Details
Closed on
Apr 19, 2021
Sold by
Torres Jesus C and Torres Teresa
Bought by
Sanchez Jose I
Purchase Details
Closed on
Apr 17, 2014
Sold by
Davidson Michael Stephen
Bought by
Torres Jesus
Home Financials for this Owner
Home Financials are based on the most recent Mortgage that was taken out on this home.
Original Mortgage
$43,200
Interest Rate
4.34%
Mortgage Type
Seller Take Back
Create a Home Valuation Report for This Property
The Home Valuation Report is an in-depth analysis detailing your home's value as well as a comparison with similar homes in the area
Home Values in the Area
Average Home Value in this Area
Purchase History
| Date | Buyer | Sale Price | Title Company |
|---|---|---|---|
| Sanchez Alvaro Angel | -- | None Listed On Document | |
| Sanchez Jose I | -- | None Available | |
| Torres Jesus | -- | None Available |
Source: Public Records
Mortgage History
| Date | Status | Borrower | Loan Amount |
|---|---|---|---|
| Previous Owner | Torres Jesus | $43,200 |
Source: Public Records
Tax History Compared to Growth
Tax History
| Year | Tax Paid | Tax Assessment Tax Assessment Total Assessment is a certain percentage of the fair market value that is determined by local assessors to be the total taxable value of land and additions on the property. | Land | Improvement |
|---|---|---|---|---|
| 2025 | $1,949 | $77,151 | $15,600 | $61,551 |
| 2024 | $1,949 | $68,033 | $4,284 | $63,749 |
| 2023 | $1,949 | $50,008 | $4,284 | $45,724 |
| 2022 | $1,588 | $50,008 | $4,284 | $45,724 |
| 2021 | $1,556 | $85,935 | $4,284 | $81,651 |
| 2020 | $801 | $40,329 | $4,284 | $36,045 |
| 2019 | $697 | $40,330 | $4,280 | $36,050 |
| 2018 | $584 | $33,570 | $4,280 | $29,290 |
| 2017 | $561 | $33,570 | $4,280 | $29,290 |
| 2016 | $983 | $33,570 | $4,280 | $29,290 |
| 2015 | $630 | $33,570 | $4,280 | $29,290 |
| 2014 | $630 | $31,320 | $4,280 | $27,040 |
Source: Public Records
Map
Nearby Homes