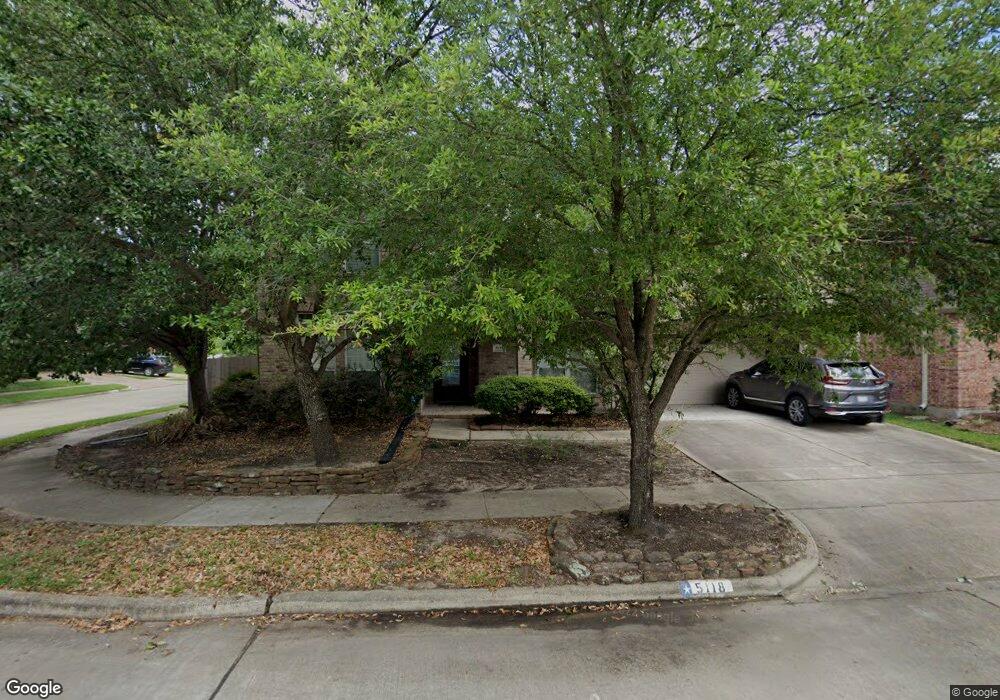
5118 W Jerad Dr Houston, TX 77018
Oak Forest-Garden Oaks NeighborhoodEstimated Value: $755,000 - $842,000
3
Beds
3
Baths
2,873
Sq Ft
$281/Sq Ft
Est. Value
About This Home
This home is located at 5118 W Jerad Dr, Houston, TX 77018 and is currently estimated at $806,305, approximately $280 per square foot. 5118 W Jerad Dr is a home located in Harris County with nearby schools including Oak Forest Elementary School, Frank Black Middle School, and Waltrip High School.
Ownership History
Date
Name
Owned For
Owner Type
Purchase Details
Closed on
Jan 24, 2012
Sold by
Cline Charles B
Bought by
Erwin Maitri and Erwin Derick
Current Estimated Value
Home Financials for this Owner
Home Financials are based on the most recent Mortgage that was taken out on this home.
Original Mortgage
$332,000
Outstanding Balance
$227,827
Interest Rate
4%
Mortgage Type
New Conventional
Estimated Equity
$578,478
Purchase Details
Closed on
Feb 24, 2009
Sold by
Cline Diane Marie
Bought by
Cline Charles
Purchase Details
Closed on
May 24, 2007
Sold by
Franz Brothers Inc
Bought by
Cline Charles B and Cline Diane M
Home Financials for this Owner
Home Financials are based on the most recent Mortgage that was taken out on this home.
Original Mortgage
$199,950
Interest Rate
6.22%
Mortgage Type
Purchase Money Mortgage
Create a Home Valuation Report for This Property
The Home Valuation Report is an in-depth analysis detailing your home's value as well as a comparison with similar homes in the area
Home Values in the Area
Average Home Value in this Area
Purchase History
| Date | Buyer | Sale Price | Title Company |
|---|---|---|---|
| Erwin Maitri | -- | None Available | |
| Cline Charles | -- | None Available | |
| Cline Charles B | -- | Partners Title Company |
Source: Public Records
Mortgage History
| Date | Status | Borrower | Loan Amount |
|---|---|---|---|
| Open | Erwin Maitri | $332,000 | |
| Previous Owner | Cline Charles B | $199,950 |
Source: Public Records
Tax History Compared to Growth
Tax History
| Year | Tax Paid | Tax Assessment Tax Assessment Total Assessment is a certain percentage of the fair market value that is determined by local assessors to be the total taxable value of land and additions on the property. | Land | Improvement |
|---|---|---|---|---|
| 2025 | $11,999 | $925,380 | $325,098 | $600,282 |
| 2024 | $11,999 | $870,360 | $200,060 | $670,300 |
| 2023 | $11,999 | $703,133 | $200,060 | $503,073 |
| 2022 | $13,964 | $634,200 | $200,060 | $434,140 |
| 2021 | $15,539 | $666,703 | $200,060 | $466,643 |
| 2020 | $15,554 | $642,318 | $200,060 | $442,258 |
| 2019 | $15,072 | $595,612 | $200,060 | $395,552 |
| 2018 | $11,922 | $600,865 | $150,045 | $450,820 |
| 2017 | $15,633 | $641,122 | $150,045 | $491,077 |
| 2016 | $14,212 | $641,122 | $150,045 | $491,077 |
| 2015 | $9,423 | $607,955 | $150,045 | $457,910 |
| 2014 | $9,423 | $549,022 | $150,045 | $398,977 |
Source: Public Records
Map
Nearby Homes
- 1802 Del Norte St Unit A
- 1802 Del Norte St Unit C
- 1804 Del Norte St Unit D
- 1804 Del Norte St Unit C
- 5128 Rosslyn Rd
- 5132 Rosslyn Rd
- 5142 Rosslyn Rd
- 5144 Rosslyn Rd
- 3913 Pinemont Dr
- 3919 Pinemont Dr
- 4410 Deer Lodge Dr
- TBD-33-46 Creekmont Dr
- 4411 Deer Lodge Dr
- 1622 Candlelight Ln
- 1402 Hewitt Dr
- 1410 Del Norte St
- 4019 Delta Rose St
- 1843 Candlelight Place Dr
- 1402 Lehman St
- 4027 Delta Rose St
- 5123 E Jerad Dr
- 5119 E Jerad Dr
- 5115 W Jerad Dr
- 5138 E Jerad Dr
- 5142 E Jerad Dr
- 5119 W Jerad Dr
- 5115 E Jerad Dr
- 5130 E Jerad Dr
- 5110 W Jerad Dr
- 5134 E Jerad Dr
- 5111 E Jerad Dr
- 5122 E Jerad Dr
- 5118 E Jerad Dr
- 5106 W Jerad Dr
- 5126 E Jerad Dr
- 5107 W Jerad Dr
- 5114 E Jerad Dr
- 5110 E Jerad Dr
- 5102 W Jerad Dr
- 5103 W Jerad Dr