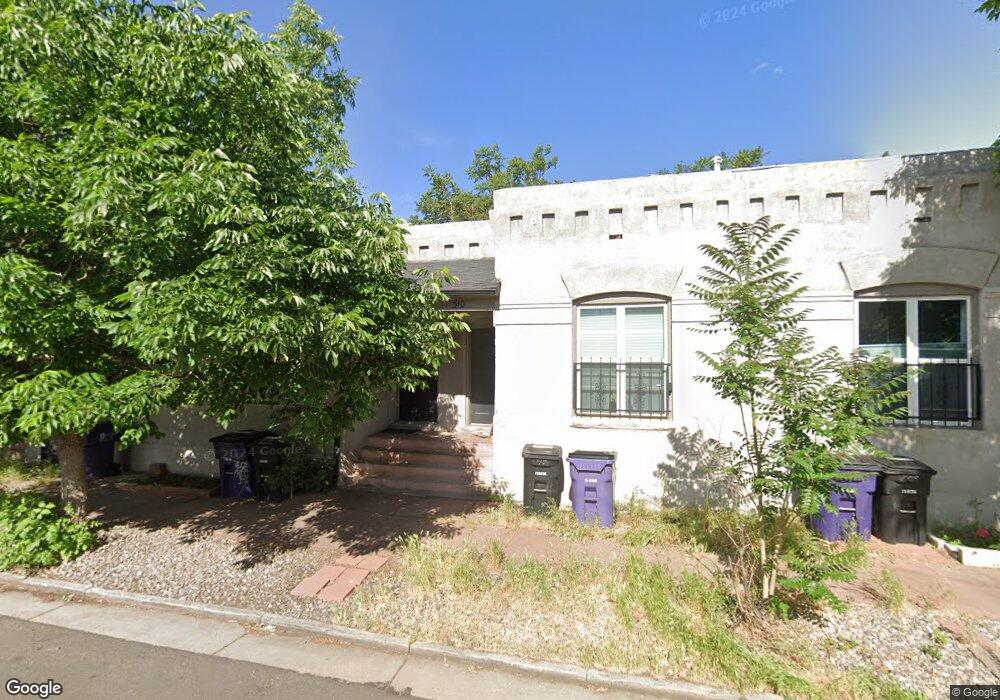
512 Cherokee St Denver, CO 80204
Baker NeighborhoodEstimated Value: $328,000 - $390,000
1
Bed
1
Bath
687
Sq Ft
$531/Sq Ft
Est. Value
About This Home
This home is located at 512 Cherokee St, Denver, CO 80204 and is currently estimated at $364,791, approximately $530 per square foot. 512 Cherokee St is a home located in Denver County with nearby schools including Kepner Beacon Middle School, West High School, and Girls Athletic Leadership School.
Ownership History
Date
Name
Owned For
Owner Type
Purchase Details
Closed on
Jan 3, 2017
Sold by
Segal Rachel
Bought by
Lewis Jory
Current Estimated Value
Home Financials for this Owner
Home Financials are based on the most recent Mortgage that was taken out on this home.
Original Mortgage
$240,000
Outstanding Balance
$197,272
Interest Rate
4.03%
Mortgage Type
New Conventional
Estimated Equity
$167,519
Purchase Details
Closed on
Sep 17, 2007
Sold by
Cantrell Justin Kester
Bought by
Segal Rachel
Home Financials for this Owner
Home Financials are based on the most recent Mortgage that was taken out on this home.
Original Mortgage
$132,525
Interest Rate
6.55%
Mortgage Type
Purchase Money Mortgage
Purchase Details
Closed on
Feb 7, 2001
Sold by
J & N Management Inc
Bought by
Cantrell Justin Kester
Home Financials for this Owner
Home Financials are based on the most recent Mortgage that was taken out on this home.
Original Mortgage
$120,000
Interest Rate
6.85%
Create a Home Valuation Report for This Property
The Home Valuation Report is an in-depth analysis detailing your home's value as well as a comparison with similar homes in the area
Home Values in the Area
Average Home Value in this Area
Purchase History
| Date | Buyer | Sale Price | Title Company |
|---|---|---|---|
| Lewis Jory | $240,000 | None Available | |
| Segal Rachel | $147,250 | Ct | |
| Cantrell Justin Kester | $142,000 | -- |
Source: Public Records
Mortgage History
| Date | Status | Borrower | Loan Amount |
|---|---|---|---|
| Open | Lewis Jory | $240,000 | |
| Previous Owner | Segal Rachel | $132,525 | |
| Previous Owner | Cantrell Justin Kester | $120,000 |
Source: Public Records
Tax History Compared to Growth
Tax History
| Year | Tax Paid | Tax Assessment Tax Assessment Total Assessment is a certain percentage of the fair market value that is determined by local assessors to be the total taxable value of land and additions on the property. | Land | Improvement |
|---|---|---|---|---|
| 2024 | $1,900 | $23,990 | $3,580 | $20,410 |
| 2023 | $1,859 | $23,990 | $3,580 | $20,410 |
| 2022 | $1,722 | $21,650 | $3,710 | $17,940 |
| 2021 | $1,722 | $22,280 | $3,820 | $18,460 |
| 2020 | $1,646 | $22,180 | $2,500 | $19,680 |
| 2019 | $1,600 | $22,180 | $2,500 | $19,680 |
| 2018 | $1,509 | $19,500 | $1,920 | $17,580 |
| 2017 | $1,504 | $19,500 | $1,920 | $17,580 |
| 2016 | $1,279 | $15,680 | $581 | $15,099 |
| 2015 | $1,225 | $15,680 | $581 | $15,099 |
| 2014 | $1,024 | $12,330 | $1,234 | $11,096 |
Source: Public Records
Map
Nearby Homes
- 314 W 5th Ave
- 469 Elati St
- 421 Elati St
- 431 Acoma St
- 510 W 4th Ave
- 616 Fox St
- 333 Delaware St
- 70 W 6th Ave Unit 100
- 410 Acoma St Unit 208
- 410 Acoma St Unit 309
- 410 Acoma St Unit 212
- 410 Acoma St Unit 206
- 334 Fox St
- 475 Galapago St Unit 3
- 274 Delaware St
- 321 Fox St
- 722 W 6th Ave
- 314 Galapago St
- 256 Bannock St
- 701 Galapago St