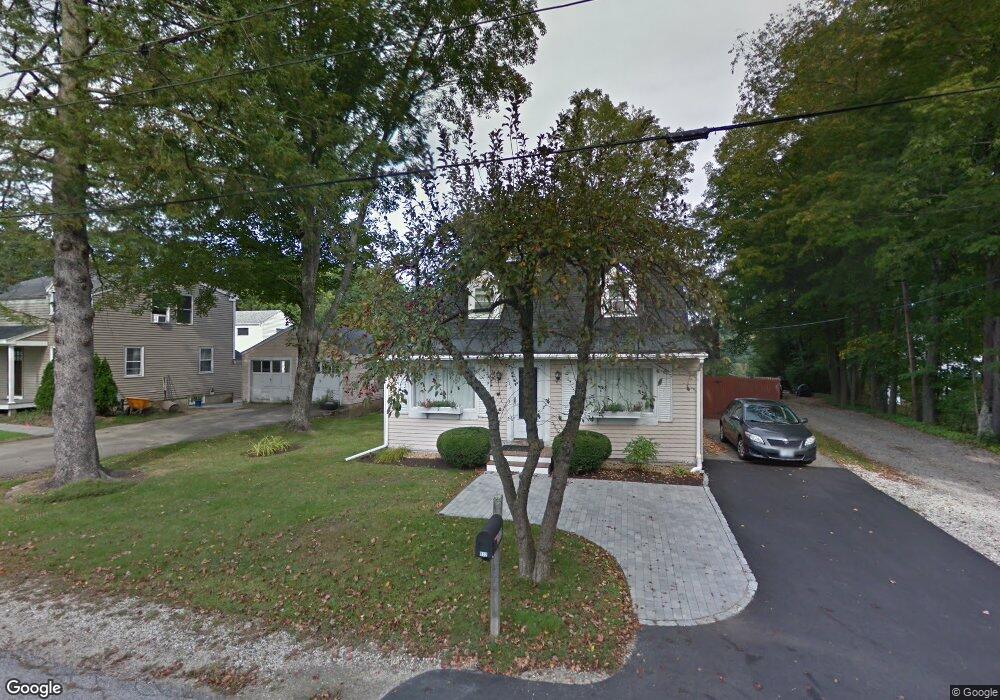
512 Locust St Rollinsford, NH 03869
Estimated Value: $408,485 - $478,000
3
Beds
1
Bath
1,525
Sq Ft
$293/Sq Ft
Est. Value
About This Home
This home is located at 512 Locust St, Rollinsford, NH 03869 and is currently estimated at $446,121, approximately $292 per square foot. 512 Locust St is a home located in Strafford County with nearby schools including Rollinsford Grade School, Berwick Academy, and Seacoast Christian School.
Ownership History
Date
Name
Owned For
Owner Type
Purchase Details
Closed on
Jun 20, 2005
Sold by
Allard Michael A
Bought by
Nadeau Terry L
Current Estimated Value
Home Financials for this Owner
Home Financials are based on the most recent Mortgage that was taken out on this home.
Original Mortgage
$213,600
Interest Rate
5.78%
Purchase Details
Closed on
Feb 20, 2002
Sold by
Hilow Richard S and Hilow Ginger M
Bought by
Allard Michael A
Home Financials for this Owner
Home Financials are based on the most recent Mortgage that was taken out on this home.
Original Mortgage
$136,111
Interest Rate
7.08%
Create a Home Valuation Report for This Property
The Home Valuation Report is an in-depth analysis detailing your home's value as well as a comparison with similar homes in the area
Home Values in the Area
Average Home Value in this Area
Purchase History
| Date | Buyer | Sale Price | Title Company |
|---|---|---|---|
| Nadeau Terry L | $224,900 | -- | |
| Nadeau Terry L | $224,900 | -- | |
| Allard Michael A | $138,000 | -- |
Source: Public Records
Mortgage History
| Date | Status | Borrower | Loan Amount |
|---|---|---|---|
| Open | Allard Michael A | $193,620 | |
| Closed | Nadeau Terry L | $213,600 | |
| Previous Owner | Allard Michael A | $136,111 |
Source: Public Records
Tax History Compared to Growth
Tax History
| Year | Tax Paid | Tax Assessment Tax Assessment Total Assessment is a certain percentage of the fair market value that is determined by local assessors to be the total taxable value of land and additions on the property. | Land | Improvement |
|---|---|---|---|---|
| 2024 | $5,291 | $322,400 | $170,200 | $152,200 |
| 2023 | $4,959 | $322,400 | $170,200 | $152,200 |
| 2022 | $4,794 | $322,400 | $170,200 | $152,200 |
| 2021 | $4,527 | $185,700 | $86,700 | $99,000 |
| 2020 | $4,583 | $185,700 | $86,700 | $99,000 |
| 2019 | $4,199 | $185,700 | $86,700 | $99,000 |
| 2018 | $4,483 | $185,700 | $86,700 | $99,000 |
| 2016 | $4,085 | $146,000 | $48,100 | $97,900 |
| 2015 | $4,005 | $146,000 | $48,100 | $97,900 |
| 2014 | $3,869 | $146,000 | $48,100 | $97,900 |
| 2013 | $3,924 | $146,000 | $48,100 | $97,900 |
Source: Public Records
Map
Nearby Homes