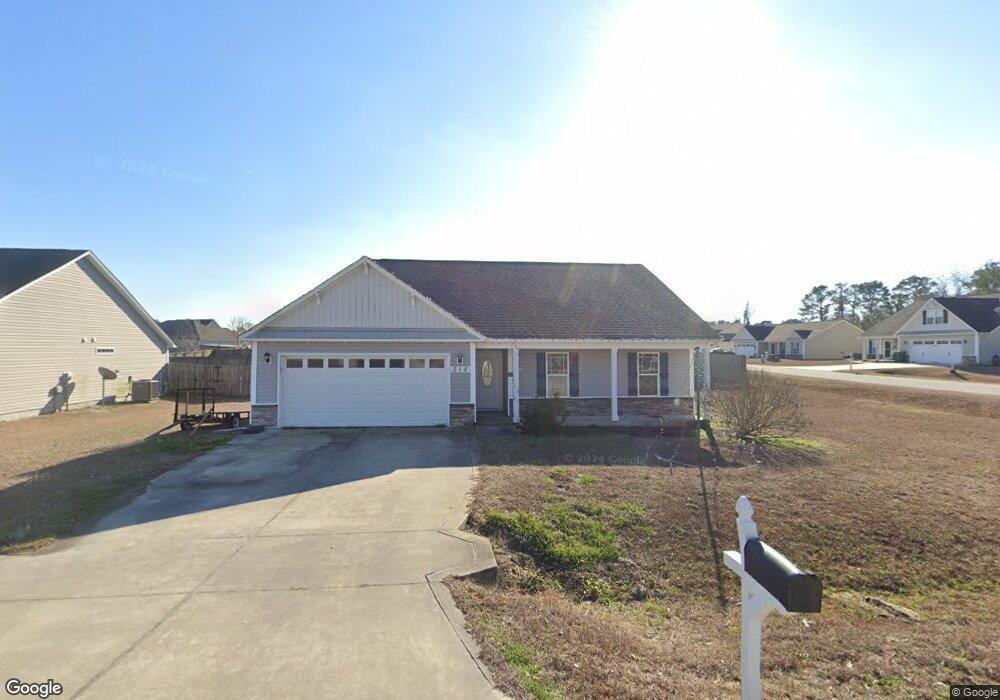
512 Poults Dr Richlands, NC 28574
Estimated Value: $257,162 - $270,000
3
Beds
2
Baths
1,387
Sq Ft
$190/Sq Ft
Est. Value
About This Home
This home is located at 512 Poults Dr, Richlands, NC 28574 and is currently estimated at $263,041, approximately $189 per square foot. 512 Poults Dr is a home located in Onslow County with nearby schools including Richlands Elementary School, Trexler Middle School, and Richlands High School.
Ownership History
Date
Name
Owned For
Owner Type
Purchase Details
Closed on
Jul 22, 2016
Sold by
Vanek Jennifer Rose and Vanek Jerry
Bought by
Coolidge Michael D
Current Estimated Value
Purchase Details
Closed on
Nov 4, 2011
Sold by
Wellmans Construction Inc
Bought by
Coolidge Michael D and Coolidge Jennifer
Home Financials for this Owner
Home Financials are based on the most recent Mortgage that was taken out on this home.
Original Mortgage
$159,750
Interest Rate
2.75%
Mortgage Type
VA
Purchase Details
Closed on
Sep 20, 2011
Sold by
Kcem Developers Llc
Bought by
Wellmans Construction Inc
Home Financials for this Owner
Home Financials are based on the most recent Mortgage that was taken out on this home.
Original Mortgage
$159,750
Interest Rate
2.75%
Mortgage Type
VA
Create a Home Valuation Report for This Property
The Home Valuation Report is an in-depth analysis detailing your home's value as well as a comparison with similar homes in the area
Home Values in the Area
Average Home Value in this Area
Purchase History
| Date | Buyer | Sale Price | Title Company |
|---|---|---|---|
| Coolidge Michael D | -- | None Available | |
| Coolidge Michael D | $156,500 | None Available | |
| Wellmans Construction Inc | $185,000 | None Available |
Source: Public Records
Mortgage History
| Date | Status | Borrower | Loan Amount |
|---|---|---|---|
| Previous Owner | Coolidge Michael D | $159,750 | |
| Previous Owner | Wellmans Construction Inc | $185,000 |
Source: Public Records
Tax History Compared to Growth
Tax History
| Year | Tax Paid | Tax Assessment Tax Assessment Total Assessment is a certain percentage of the fair market value that is determined by local assessors to be the total taxable value of land and additions on the property. | Land | Improvement |
|---|---|---|---|---|
| 2025 | $859 | $176,210 | $30,000 | $146,210 |
| 2024 | $859 | $176,210 | $30,000 | $146,210 |
| 2023 | $859 | $176,210 | $30,000 | $146,210 |
| 2022 | $859 | $176,210 | $30,000 | $146,210 |
| 2021 | $763 | $153,240 | $30,000 | $123,240 |
| 2020 | $763 | $153,240 | $30,000 | $123,240 |
| 2019 | $763 | $153,240 | $30,000 | $123,240 |
| 2018 | $763 | $153,240 | $30,000 | $123,240 |
| 2017 | $927 | $137,350 | $30,000 | $107,350 |
| 2016 | $927 | $137,350 | $0 | $0 |
| 2015 | $927 | $137,350 | $0 | $0 |
| 2014 | $927 | $137,350 | $0 | $0 |
Source: Public Records
Map
Nearby Homes
- 109 Floyd Pond Ln
- 105 Linden Rd
- 119 Edgewater Ln
- 106 Orchard Dr
- 227 Bannermans Mill Rd
- 235 Westfield Dr
- 224 Rowland Dr
- 712 Addor Dr
- 503 Hester Ct
- 150 Mattie Ln
- 250 Rowland Dr
- 2037 Catherine Lake Rd
- 260 Rowland Dr
- 204 Chappell Creek Ct
- 146 Saint Rd
- 144 Saint Rd
- 200 Silver Ct
- 501 Bannermans Mill Rd
- 115 Flat Rock Ln
- 510 Bannermans Mill Rd