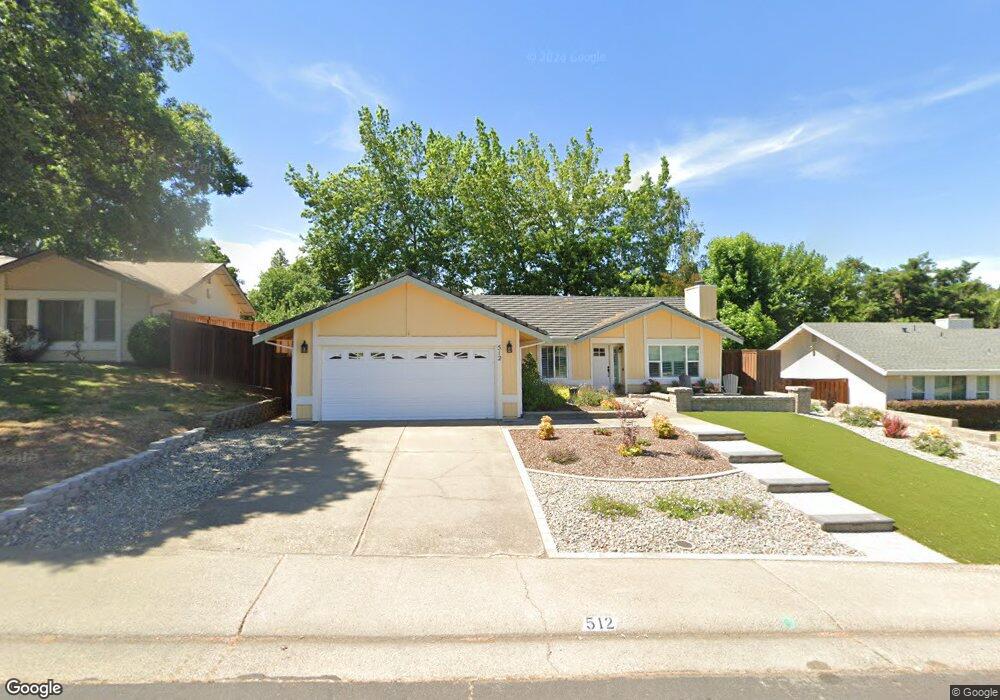
512 Willow Creek Dr Folsom, CA 95630
Briggs Ranch NeighborhoodEstimated Value: $597,000 - $665,000
3
Beds
2
Baths
1,371
Sq Ft
$457/Sq Ft
Est. Value
About This Home
This home is located at 512 Willow Creek Dr, Folsom, CA 95630 and is currently estimated at $625,982, approximately $456 per square foot. 512 Willow Creek Dr is a home located in Sacramento County with nearby schools including Blanche Sprentz Elementary School, Sutter Middle School, and St. John Notre Dame School.
Ownership History
Date
Name
Owned For
Owner Type
Purchase Details
Closed on
Aug 13, 2014
Sold by
Schultz Lee Ann
Bought by
Schultz Lee Ann and The Lee Ann Schultz Family Tru
Current Estimated Value
Purchase Details
Closed on
Oct 4, 2012
Sold by
Lloyd Schultz Lee Ann and Lloyd Leandro Jr Richard
Bought by
Schultz Lee Ann
Home Financials for this Owner
Home Financials are based on the most recent Mortgage that was taken out on this home.
Original Mortgage
$155,000
Outstanding Balance
$107,686
Interest Rate
3.58%
Mortgage Type
New Conventional
Estimated Equity
$518,296
Purchase Details
Closed on
Jul 24, 1998
Sold by
Starsky Jeffrey Michael
Bought by
Lloyd Schultz Lee Ann and Lloyd Leandro Jr Richard
Home Financials for this Owner
Home Financials are based on the most recent Mortgage that was taken out on this home.
Original Mortgage
$144,400
Interest Rate
6.9%
Purchase Details
Closed on
Dec 23, 1997
Sold by
Starsky Beckie Sue
Bought by
Starsky Jeffrey Michael
Create a Home Valuation Report for This Property
The Home Valuation Report is an in-depth analysis detailing your home's value as well as a comparison with similar homes in the area
Home Values in the Area
Average Home Value in this Area
Purchase History
| Date | Buyer | Sale Price | Title Company |
|---|---|---|---|
| Schultz Lee Ann | -- | None Available | |
| Schultz Lee Ann | -- | Chicago Title Company | |
| Lloyd Schultz Lee Ann | $152,000 | Chicago Title Co | |
| Starsky Jeffrey Michael | -- | -- |
Source: Public Records
Mortgage History
| Date | Status | Borrower | Loan Amount |
|---|---|---|---|
| Open | Schultz Lee Ann | $155,000 | |
| Closed | Lloyd Schultz Lee Ann | $144,400 |
Source: Public Records
Tax History Compared to Growth
Tax History
| Year | Tax Paid | Tax Assessment Tax Assessment Total Assessment is a certain percentage of the fair market value that is determined by local assessors to be the total taxable value of land and additions on the property. | Land | Improvement |
|---|---|---|---|---|
| 2025 | $2,706 | $253,345 | $94,593 | $158,752 |
| 2024 | $2,706 | $248,379 | $92,739 | $155,640 |
| 2023 | $2,658 | $243,510 | $90,921 | $152,589 |
| 2022 | $2,620 | $238,737 | $89,139 | $149,598 |
| 2021 | $2,585 | $234,057 | $87,392 | $146,665 |
| 2020 | $2,553 | $231,658 | $86,496 | $145,162 |
| 2019 | $2,511 | $227,116 | $84,800 | $142,316 |
| 2018 | $2,448 | $222,664 | $83,138 | $139,526 |
| 2017 | $2,283 | $218,299 | $81,508 | $136,791 |
| 2016 | $2,386 | $214,019 | $79,910 | $134,109 |
| 2015 | $2,306 | $210,805 | $78,710 | $132,095 |
| 2014 | $2,189 | $206,677 | $77,169 | $129,508 |
Source: Public Records
Map
Nearby Homes
- 109 Johnston Ct
- 128 Mesquite Ct
- 260 Flower Dr
- 164 Rebecca Way
- 237 Evelyn Way
- 124 Windstar Cir
- 106 Rhoades Way
- 1118 Buckbrush Dr
- 103 Grenoble Way
- 124 Fargo Way
- 102 Grenoble Way
- 1173 Boxelder Cir
- 214 Rugosa Dr
- 1113 Kingfisher Cir
- 108 Bloomfield Way
- 408-408 1/2 Reading St
- 616-616 1/2 Mormon St
- 151 Glenn Dr
- 0 Figueroa St Unit 225034113
- 429 N Lexington Dr
- 508 Willow Creek Dr
- 105 Cradle Bar Ct
- 504 Willow Creek Dr
- 103 Cradle Bar Ct
- 520 Willow Creek Dr
- 107 Cradle Bar Ct
- 554 Willow Creek Dr
- 513 Willow Creek Dr
- 562 Willow Creek Dr
- 570 Willow Creek Dr
- 517 Willow Creek Dr
- 509 Willow Creek Dr
- 101 Cradle Bar Ct
- 521 Willow Creek Dr
- 505 Willow Creek Dr
- 550 Flower Dr
- 109 Cradle Bar Ct
- 104 Cradle Bar Ct
- 525 Willow Creek Dr
- 540 Flower Dr