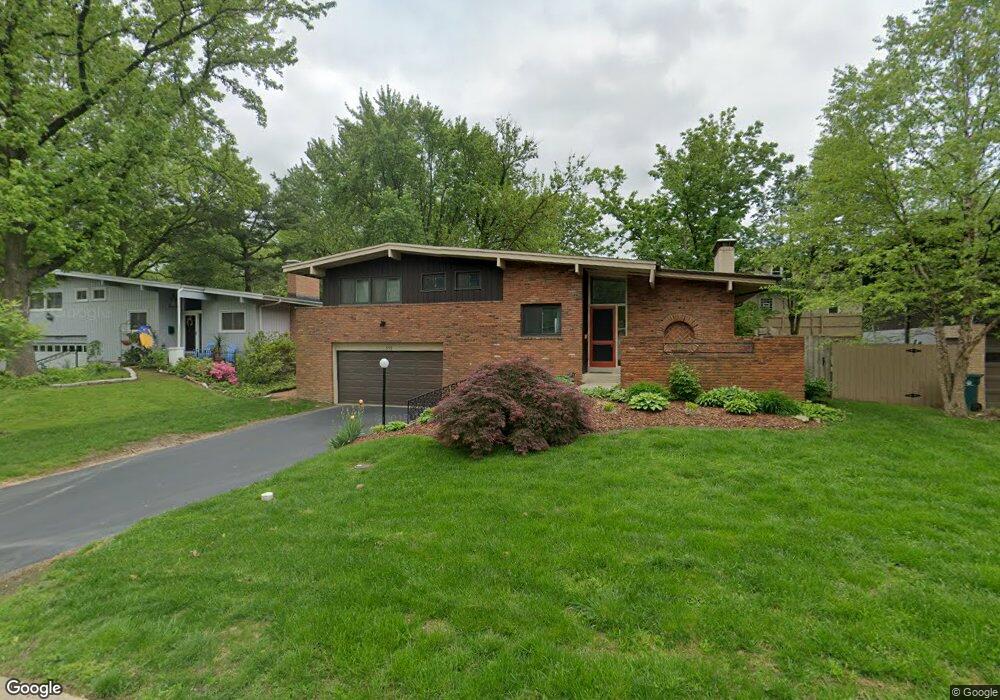
512 Woodleaf Ct Saint Louis, MO 63122
Estimated Value: $402,855 - $486,000
3
Beds
2
Baths
1,525
Sq Ft
$288/Sq Ft
Est. Value
About This Home
This home is located at 512 Woodleaf Ct, Saint Louis, MO 63122 and is currently estimated at $439,214, approximately $288 per square foot. 512 Woodleaf Ct is a home located in St. Louis County with nearby schools including F.P. Tillman Elementary School, North Kirkwood Middle School, and Kirkwood Senior High School.
Ownership History
Date
Name
Owned For
Owner Type
Purchase Details
Closed on
Jun 25, 2007
Sold by
Campbell Peter S and Maginn Susan
Bought by
Bronstein Evan and Bronstein Leah
Current Estimated Value
Home Financials for this Owner
Home Financials are based on the most recent Mortgage that was taken out on this home.
Original Mortgage
$184,250
Outstanding Balance
$112,742
Interest Rate
6.19%
Mortgage Type
Purchase Money Mortgage
Estimated Equity
$326,472
Purchase Details
Closed on
Mar 27, 2003
Sold by
Mcnally James P
Bought by
Campbell Peter S and Maginn Susan
Home Financials for this Owner
Home Financials are based on the most recent Mortgage that was taken out on this home.
Original Mortgage
$172,000
Interest Rate
6.42%
Mortgage Type
Purchase Money Mortgage
Purchase Details
Closed on
Jul 31, 2000
Sold by
Beck Gorden A and Beck Sally A
Bought by
Mcnally James P
Home Financials for this Owner
Home Financials are based on the most recent Mortgage that was taken out on this home.
Original Mortgage
$179,900
Interest Rate
8.15%
Create a Home Valuation Report for This Property
The Home Valuation Report is an in-depth analysis detailing your home's value as well as a comparison with similar homes in the area
Home Values in the Area
Average Home Value in this Area
Purchase History
| Date | Buyer | Sale Price | Title Company |
|---|---|---|---|
| Bronstein Evan | $232,500 | None Available | |
| Campbell Peter S | $215,000 | -- | |
| Mcnally James P | $199,900 | -- |
Source: Public Records
Mortgage History
| Date | Status | Borrower | Loan Amount |
|---|---|---|---|
| Open | Bronstein Evan | $184,250 | |
| Previous Owner | Campbell Peter S | $172,000 | |
| Previous Owner | Mcnally James P | $179,900 |
Source: Public Records
Tax History Compared to Growth
Tax History
| Year | Tax Paid | Tax Assessment Tax Assessment Total Assessment is a certain percentage of the fair market value that is determined by local assessors to be the total taxable value of land and additions on the property. | Land | Improvement |
|---|---|---|---|---|
| 2025 | $3,663 | $67,140 | $46,680 | $20,460 |
| 2024 | $3,663 | $58,210 | $38,890 | $19,320 |
| 2023 | $3,606 | $58,210 | $38,890 | $19,320 |
| 2022 | $3,624 | $54,590 | $37,240 | $17,350 |
| 2021 | $3,577 | $54,590 | $37,240 | $17,350 |
| 2020 | $3,240 | $47,520 | $37,240 | $10,280 |
| 2019 | $3,241 | $47,520 | $37,240 | $10,280 |
| 2018 | $3,457 | $44,790 | $28,010 | $16,780 |
| 2017 | $3,452 | $44,790 | $28,010 | $16,780 |
| 2016 | $2,853 | $37,240 | $21,790 | $15,450 |
| 2015 | $2,849 | $37,240 | $21,790 | $15,450 |
| 2014 | $2,913 | $37,240 | $11,000 | $26,240 |
Source: Public Records
Map
Nearby Homes
- 551 Brookhaven Ct
- 641 Brookhaven Ct
- 1 Dickson Ct
- 754 Brownell Ave
- 1030 Sylvan Place
- 830 Victoria Place
- 826 Chelsea Ave
- 858 Chelsea Ave
- 1306 Glendale Gardens Dr Unit B
- 1306 Glendale Gardens Dr Unit C
- 125 Swan Ave
- 1095 N Sappington Rd
- 832 Fuhrmann Terrace
- 931 Brownell Ave
- 803 N Kirkwood Rd
- 807 E Essex Ave
- 438 N Sappington Rd Unit B
- 436 N Sappington Rd Unit C
- 830 N Clay Ave
- 1025 Glenmoor Ln
- 520 Woodleaf Ct
- 500 Woodleaf Ct
- 860 N Woodlawn Ave
- 858 N Woodlawn Ave
- 528 Woodleaf Ct
- 513 Woodleaf Ct
- 519 Woodleaf Ct
- 501 Woodleaf Ct
- 856 N Woodlawn Ave
- 529 Woodleaf Ct
- 534 Woodleaf Ct
- 873 N Woodlawn Ave
- 877 N Woodlawn Ave
- 883 N Woodlawn Ave
- 435 Woodview Manor Ln
- 852 N Woodlawn Ave
- 858 Doerwood Ct
- 533 Woodleaf Ct
- 900 N Woodlawn Ave
- 562 Southbrook Dr