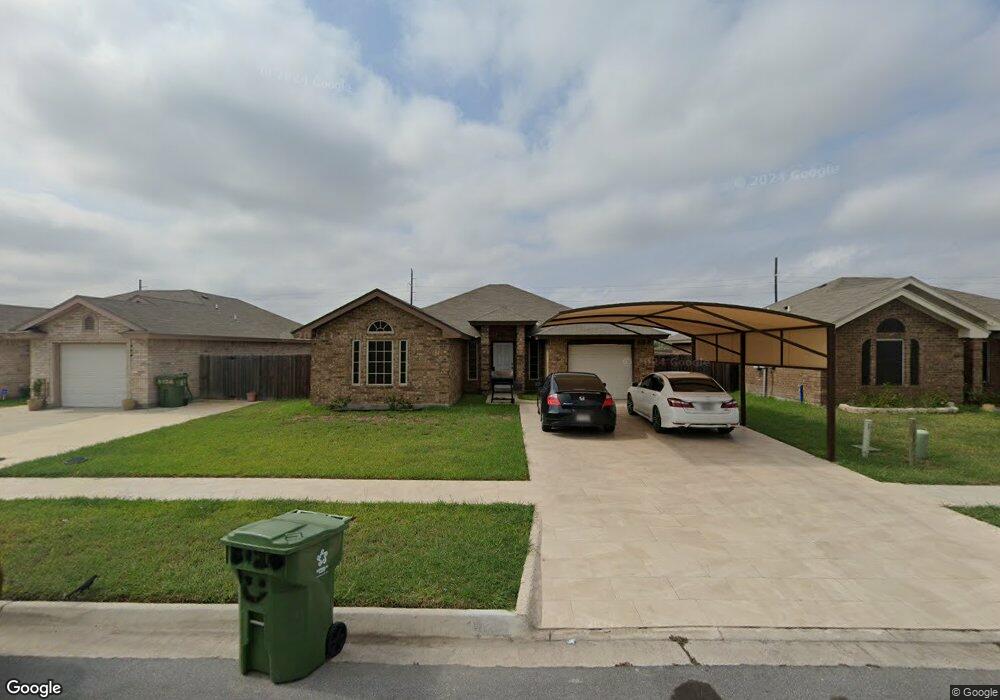
5120 Sedona Place Brownsville, TX 78520
Estimated Value: $209,456 - $264,000
--
Bed
--
Bath
1,482
Sq Ft
$158/Sq Ft
Est. Value
About This Home
This home is located at 5120 Sedona Place, Brownsville, TX 78520 and is currently estimated at $234,364, approximately $158 per square foot. 5120 Sedona Place is a home with nearby schools including Mittie A. Pullam Elementary School, Stillman Middle School, and Veterans Memorial Early College High School.
Ownership History
Date
Name
Owned For
Owner Type
Purchase Details
Closed on
Aug 9, 2022
Sold by
Emanuel Lara
Bought by
Lara Emanuel and Quijada Michelle
Current Estimated Value
Home Financials for this Owner
Home Financials are based on the most recent Mortgage that was taken out on this home.
Original Mortgage
$180,000
Outstanding Balance
$172,346
Interest Rate
5.7%
Mortgage Type
Credit Line Revolving
Estimated Equity
$62,019
Purchase Details
Closed on
Apr 24, 2017
Sold by
N O Simmons Homes Ltd
Bought by
Lara Emanuel and Quijada Michelle
Home Financials for this Owner
Home Financials are based on the most recent Mortgage that was taken out on this home.
Original Mortgage
$125,582
Interest Rate
3.87%
Mortgage Type
FHA
Purchase Details
Closed on
Oct 5, 2016
Sold by
El Valle Investments Ltd
Bought by
N O Simmons Homes Ltd
Create a Home Valuation Report for This Property
The Home Valuation Report is an in-depth analysis detailing your home's value as well as a comparison with similar homes in the area
Home Values in the Area
Average Home Value in this Area
Purchase History
| Date | Buyer | Sale Price | Title Company |
|---|---|---|---|
| Lara Emanuel | -- | Stewart Title Guaranty Company | |
| Lara Emanuel | -- | Stewart Title Company | |
| N O Simmons Homes Ltd | -- | None Available |
Source: Public Records
Mortgage History
| Date | Status | Borrower | Loan Amount |
|---|---|---|---|
| Open | Lara Emanuel | $180,000 | |
| Previous Owner | Lara Emanuel | $125,582 |
Source: Public Records
Tax History Compared to Growth
Tax History
| Year | Tax Paid | Tax Assessment Tax Assessment Total Assessment is a certain percentage of the fair market value that is determined by local assessors to be the total taxable value of land and additions on the property. | Land | Improvement |
|---|---|---|---|---|
| 2025 | $4,716 | $205,684 | $61,275 | $144,409 |
| 2024 | $4,716 | $207,155 | $61,275 | $145,880 |
| 2023 | $4,366 | $190,291 | $45,600 | $144,691 |
| 2022 | $3,740 | $144,189 | $37,500 | $106,689 |
| 2021 | $3,755 | $145,261 | $37,500 | $107,761 |
| 2020 | $3,812 | $146,336 | $37,500 | $108,836 |
| 2019 | $3,619 | $135,910 | $26,000 | $109,910 |
| 2018 | $3,391 | $127,682 | $26,000 | $101,682 |
| 2017 | $2,438 | $96,194 | $21,000 | $75,194 |
| 2016 | $159 | $6,270 | $6,270 | $0 |
Source: Public Records
Map
Nearby Homes
- 124 Grand Rapids Ln
- 5009 Sedona Place
- 3770 Ridge Trail
- 3568 Simmons Place Ct
- 3461 Beacon Ct
- 4025 Sevilla St
- 3516 Hidalgo Cir Unit LOT 1 BLK 4
- 3604 Hidalgo Cir Unit LOT 1 BLK 6
- 00 Laredo Rd
- 3949 Galicia Ct Unit 17
- 3837 Ridge Trail
- 4170 Oak Hurst Dr
- 203 Gilson Rd
- 109 Dix Dr
- 3804 N Shore Trail
- 4071 Orense Dr
- 3770 Altamira
- 257 Peach Rose Ct
- 4012 Ridge Trail
- 104 Marian Place
- 5116 Sedona Place
- 5124 Sedona Place
- 5112 Sedona Place
- 5128 Sedona Place
- 5132 Sedona Place
- 5108 Sedona Place
- 5121 Sedona Place
- 5117 Sedona Place
- 5125 Sedona Place
- 5129 Sedona Place
- 5104 Sedona Place
- 5136 Sedona Place
- 5113 Sedona Place
- 5109 Sedona Place
- 5133 Sedona Place
- 5100 Sedona Place
- 5140 Sedona Place
- 5137 Sedona Place
- 5105 Sedona Place
- 5096 Sedona Place