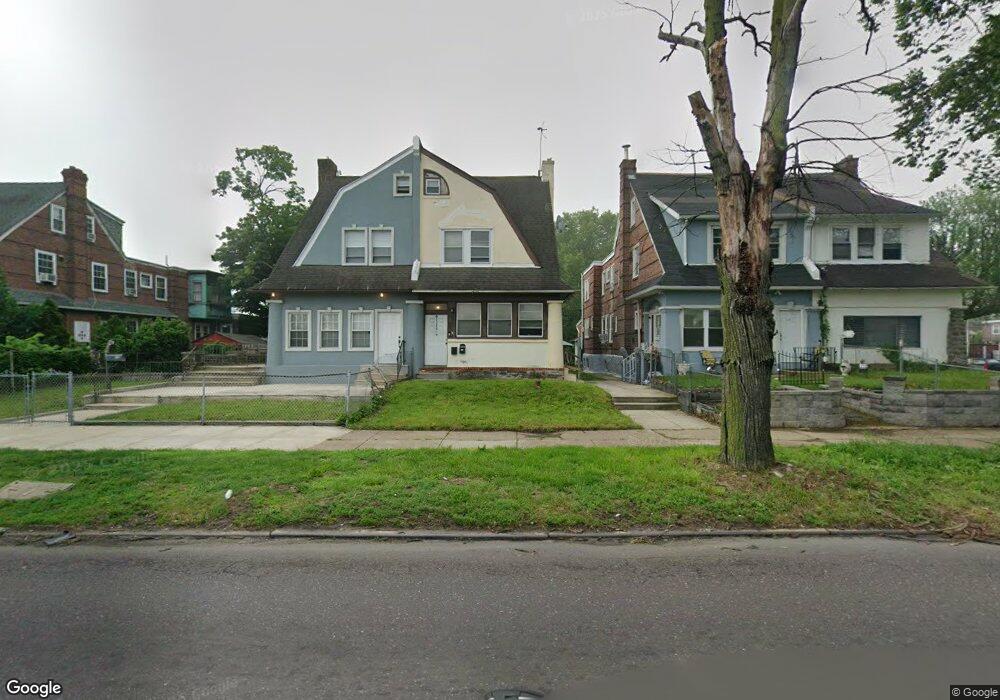
5121 Roosevelt Blvd Philadelphia, PA 19124
Lawncrest NeighborhoodEstimated Value: $270,000
--
Bed
--
Bath
2,235
Sq Ft
$121/Sq Ft
Est. Value
About This Home
This home is located at 5121 Roosevelt Blvd, Philadelphia, PA 19124 and is currently estimated at $270,000, approximately $120 per square foot. 5121 Roosevelt Blvd is a home located in Philadelphia County with nearby schools including Frankford High School, The Philadelphia Charter School for the Arts & Sciences, and Northwood Academy Charter School.
Ownership History
Date
Name
Owned For
Owner Type
Purchase Details
Closed on
May 29, 2015
Sold by
Shore Lindsey N and Rourke Lindsey N O
Bought by
Rourke Sean O and Rourke Lindsey N O
Current Estimated Value
Home Financials for this Owner
Home Financials are based on the most recent Mortgage that was taken out on this home.
Original Mortgage
$143,000
Outstanding Balance
$109,723
Interest Rate
3.65%
Mortgage Type
Commercial
Estimated Equity
$160,277
Purchase Details
Closed on
Apr 30, 2008
Sold by
Shore Larry
Bought by
Shore Lindsey N
Home Financials for this Owner
Home Financials are based on the most recent Mortgage that was taken out on this home.
Original Mortgage
$155,200
Interest Rate
5.99%
Mortgage Type
Commercial
Purchase Details
Closed on
May 18, 2007
Sold by
Hardy David P
Bought by
Shore Larry
Purchase Details
Closed on
Apr 20, 2007
Sold by
Proietta Joseph H and Proietta Alberta D
Bought by
Hardy David P
Purchase Details
Closed on
Aug 2, 1994
Sold by
Curry Thomas Robert and Curry Katherine
Bought by
Proietta Joseph H and Proietta Alberta D
Create a Home Valuation Report for This Property
The Home Valuation Report is an in-depth analysis detailing your home's value as well as a comparison with similar homes in the area
Home Values in the Area
Average Home Value in this Area
Purchase History
| Date | Buyer | Sale Price | Title Company |
|---|---|---|---|
| Rourke Sean O | -- | None Available | |
| Shore Lindsey N | -- | None Available | |
| Shore Larry | $65,000 | None Available | |
| Hardy David P | $43,530 | None Available | |
| Proietta Joseph H | $56,000 | Commonwealth Land Title Ins |
Source: Public Records
Mortgage History
| Date | Status | Borrower | Loan Amount |
|---|---|---|---|
| Open | Rourke Sean O | $143,000 | |
| Closed | Shore Lindsey N | $155,200 |
Source: Public Records
Tax History Compared to Growth
Tax History
| Year | Tax Paid | Tax Assessment Tax Assessment Total Assessment is a certain percentage of the fair market value that is determined by local assessors to be the total taxable value of land and additions on the property. | Land | Improvement |
|---|---|---|---|---|
| 2026 | $3,928 | $268,400 | $53,680 | $214,720 |
| 2025 | $3,928 | $268,400 | $53,680 | $214,720 |
| 2024 | $3,928 | $268,400 | $53,680 | $214,720 |
| 2023 | $3,928 | $280,600 | $56,120 | $224,480 |
| 2022 | $1,972 | $280,600 | $56,120 | $224,480 |
| 2021 | $1,972 | $0 | $0 | $0 |
| 2020 | $1,972 | $0 | $0 | $0 |
| 2019 | $1,893 | $0 | $0 | $0 |
| 2018 | $1,832 | $0 | $0 | $0 |
| 2017 | $1,832 | $0 | $0 | $0 |
| 2016 | $1,832 | $0 | $0 | $0 |
| 2015 | $1,754 | $0 | $0 | $0 |
| 2014 | -- | $130,900 | $39,526 | $91,374 |
| 2012 | -- | $18,656 | $3,149 | $15,507 |
Source: Public Records
Map
Nearby Homes
- 5505 Loretto Ave
- 4046 E Roosevelt Blvd
- 1048 Bridge St
- 5640 Miriam Rd
- 5659 Miriam Rd
- 5661 Miriam Rd
- 934 Brill St
- 894 Granite St
- 1859 Harrison St
- 1052 Allengrove St
- 880 Granite St
- 934 E Sanger St
- 991 Carver St
- 1137 Bridge St
- 996 Anchor St
- 925 E Sanger St
- 926 Foulkrod St
- 1204 Pratt St
- 894 E Sanger St
- 883 Brill St
- 5121 E Roosevelt Blvd Unit 1
- 5121 E Roosevelt Blvd Unit 2
- 5121 E Roosevelt Blvd
- 5121 E Roosevelt Blvd Unit A
- 5119 Roosevelt Blvd
- 5123 Roosevelt Blvd
- 5117 Roosevelt Blvd
- 5129 Roosevelt Blvd
- 947 Kenwyn St
- 5131 Roosevelt Blvd
- 949 Kenwyn St
- 5133 Roosevelt Blvd
- 5133 E Roosevelt Blvd Unit 3F
- 5115 Roosevelt Blvd
- 5115 E Roosevelt Blvd
- 5135 E Roosevelt Blvd
- 5135 Roosevelt Blvd
- 944 Kenwyn St
- 5113 Roosevelt Blvd
- 946 Kenwyn St