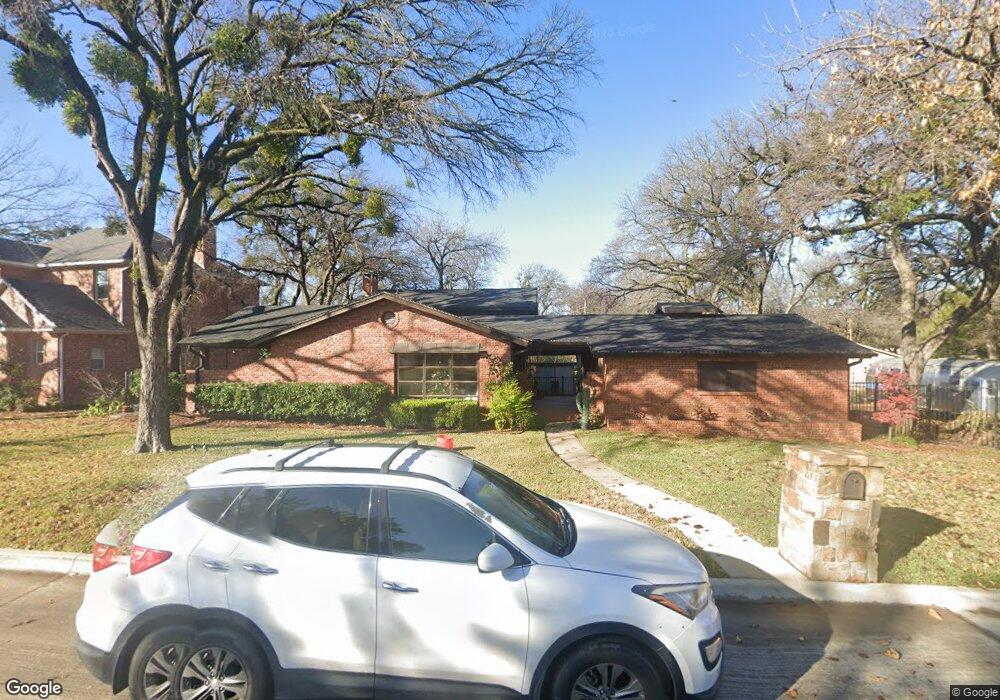
5125 Jennings Dr North Richland Hills, TX 76180
Estimated Value: $334,499 - $394,000
3
Beds
2
Baths
1,846
Sq Ft
$197/Sq Ft
Est. Value
About This Home
This home is located at 5125 Jennings Dr, North Richland Hills, TX 76180 and is currently estimated at $364,250, approximately $197 per square foot. 5125 Jennings Dr is a home located in Tarrant County with nearby schools including Jack C Binion Elementary School, Richland Middle School, and Birdville High School.
Ownership History
Date
Name
Owned For
Owner Type
Purchase Details
Closed on
Jun 18, 2021
Sold by
Farmer Misty Laine
Bought by
Mccasland Joshua D and Mccasland Melissa L
Current Estimated Value
Home Financials for this Owner
Home Financials are based on the most recent Mortgage that was taken out on this home.
Original Mortgage
$282,600
Outstanding Balance
$255,859
Interest Rate
2.9%
Mortgage Type
New Conventional
Estimated Equity
$108,391
Purchase Details
Closed on
Apr 2, 2015
Sold by
Dorety Cynthia
Bought by
Farmer Misty Laine
Home Financials for this Owner
Home Financials are based on the most recent Mortgage that was taken out on this home.
Original Mortgage
$137,750
Interest Rate
3.82%
Mortgage Type
Purchase Money Mortgage
Purchase Details
Closed on
Jan 13, 2014
Sold by
Erwin Charles E
Bought by
Dorety Robert
Create a Home Valuation Report for This Property
The Home Valuation Report is an in-depth analysis detailing your home's value as well as a comparison with similar homes in the area
Home Values in the Area
Average Home Value in this Area
Purchase History
| Date | Buyer | Sale Price | Title Company |
|---|---|---|---|
| Mccasland Joshua D | -- | First American Title Ins Co | |
| Farmer Misty Laine | $172,200 | Republic Title Of Texas Inc | |
| Dorety Robert | -- | None Available |
Source: Public Records
Mortgage History
| Date | Status | Borrower | Loan Amount |
|---|---|---|---|
| Open | Mccasland Joshua D | $282,600 | |
| Previous Owner | Farmer Misty Laine | $137,750 |
Source: Public Records
Tax History Compared to Growth
Tax History
| Year | Tax Paid | Tax Assessment Tax Assessment Total Assessment is a certain percentage of the fair market value that is determined by local assessors to be the total taxable value of land and additions on the property. | Land | Improvement |
|---|---|---|---|---|
| 2025 | $6,056 | $279,084 | $137,275 | $141,809 |
| 2024 | $6,056 | $279,084 | $137,275 | $141,809 |
| 2023 | $6,579 | $299,907 | $137,275 | $162,632 |
| 2022 | $6,606 | $274,513 | $137,275 | $137,238 |
| 2021 | $5,953 | $233,956 | $34,212 | $199,744 |
| 2020 | $5,449 | $218,324 | $34,212 | $184,112 |
| 2019 | $5,126 | $210,428 | $35,000 | $175,428 |
| 2018 | $4,142 | $176,971 | $35,000 | $141,971 |
| 2017 | $4,359 | $162,000 | $35,000 | $127,000 |
| 2016 | $5,072 | $188,519 | $23,000 | $165,519 |
| 2015 | $2,246 | $120,321 | $22,482 | $97,839 |
| 2014 | $2,246 | $83,600 | $22,500 | $61,100 |
Source: Public Records
Map
Nearby Homes
- 5016 Wyoming Trail
- 5304 Colorado Blvd
- 5020 Colorado Blvd
- 5113 Bob Dr
- 8417 Emerald Cir
- 8020 Laura St
- 8304 Emerald Cir
- 1230 Wooded Trail
- 1230 Woodland Park Dr
- 7908 Lazy Lane Rd
- 1218 Wooded Trail
- 1220 Woodland Park Dr
- 823 W Harwood Rd
- 5336 Davis Blvd
- 6001 Kessler Dr
- 6008 Kessler Dr
- 853 Royal Terrace
- 7717 Janetta Dr
- 6025 Kessler Dr
- 1204 Princess Ln
- 5137 Jennings Dr
- 5121 Jennings Dr
- 5124 Jennings Dr
- 5128 Jennings Dr
- 5120 Jennings Dr
- 5122 Pearl Dr
- 5141 Jennings Dr
- 5140 Jennings Dr
- 5132 Jennings Dr
- 5120 Pearl Dr
- 5116 Jennings Dr
- 5124 Pearl Dr
- 5145 Jennings Dr
- 5112 Pearl Dr
- 5128 Pearl Dr
- 5109 Jennings Dr
- 5149 Jennings Dr
- 8320 Dude Ct
- 5132 Pearl Dr
- 5121 Pearl Dr