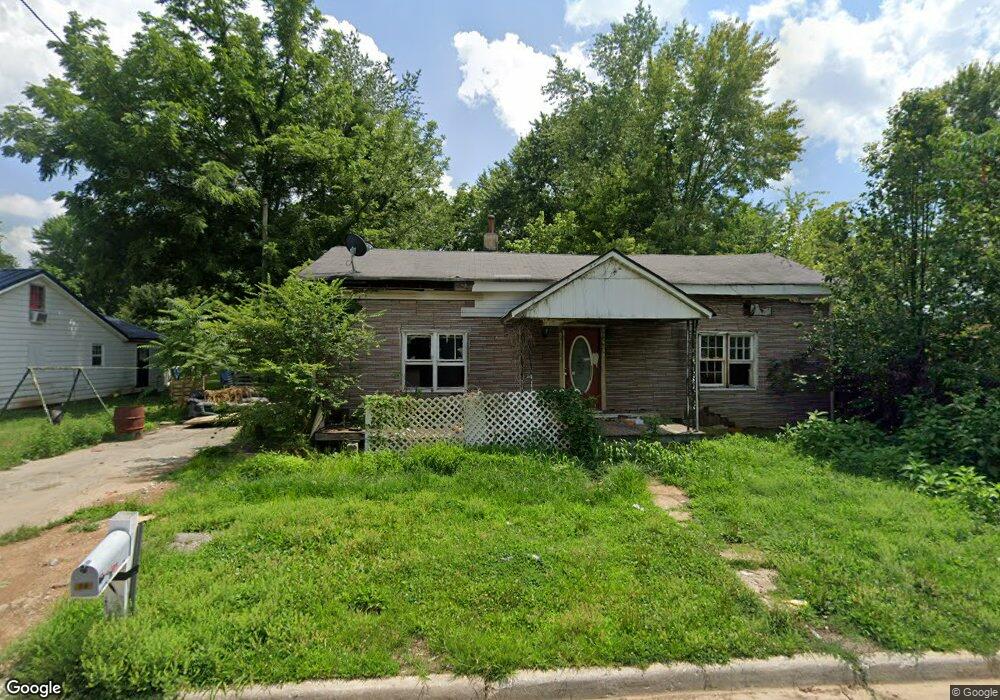
513 4th St Lawrenceburg, TN 38464
Estimated Value: $126,000 - $202,000
--
Bed
1
Bath
1,364
Sq Ft
$122/Sq Ft
Est. Value
About This Home
This home is located at 513 4th St, Lawrenceburg, TN 38464 and is currently estimated at $167,000, approximately $122 per square foot. 513 4th St is a home located in Lawrence County with nearby schools including Ingram Sowell Elementary School, Lawrenceburg Public Elementary School, and David Crockett Elementary School.
Ownership History
Date
Name
Owned For
Owner Type
Purchase Details
Closed on
Mar 9, 2023
Sold by
Polk Richard
Bought by
Kilburn Steve
Current Estimated Value
Purchase Details
Closed on
Jul 20, 2010
Sold by
Wheeley Brent
Bought by
Polk Richard
Home Financials for this Owner
Home Financials are based on the most recent Mortgage that was taken out on this home.
Original Mortgage
$17,150
Interest Rate
4.7%
Purchase Details
Closed on
Feb 20, 2009
Sold by
Odeneal K C
Bought by
Duke Josh
Purchase Details
Closed on
Sep 8, 2008
Sold by
Federal Home Loan Mortgage Corporation
Bought by
Odeneal K C
Purchase Details
Closed on
May 6, 2008
Sold by
Curtis Melvin C
Bought by
Federal Home Loan Mtg Corp
Purchase Details
Closed on
Jun 25, 1949
Bought by
Curtis Melvin and Curtis Sybil
Create a Home Valuation Report for This Property
The Home Valuation Report is an in-depth analysis detailing your home's value as well as a comparison with similar homes in the area
Home Values in the Area
Average Home Value in this Area
Purchase History
| Date | Buyer | Sale Price | Title Company |
|---|---|---|---|
| Kilburn Steve | $20,000 | -- | |
| Polk Richard | $18,000 | -- | |
| Duke Josh | $11,000 | -- | |
| Odeneal K C | $7,900 | -- | |
| Federal Home Loan Mtg Corp | -- | -- | |
| Curtis Melvin | -- | -- |
Source: Public Records
Mortgage History
| Date | Status | Borrower | Loan Amount |
|---|---|---|---|
| Previous Owner | Curtis Melvin | $17,150 |
Source: Public Records
Tax History Compared to Growth
Tax History
| Year | Tax Paid | Tax Assessment Tax Assessment Total Assessment is a certain percentage of the fair market value that is determined by local assessors to be the total taxable value of land and additions on the property. | Land | Improvement |
|---|---|---|---|---|
| 2025 | $46 | $68,320 | $0 | $0 |
| 2024 | $210 | $1,500 | $1,500 | $0 |
| 2023 | $210 | $1,500 | $1,500 | $0 |
| 2022 | $210 | $6,775 | $1,500 | $5,275 |
| 2021 | $205 | $4,650 | $1,500 | $3,150 |
| 2020 | $205 | $4,650 | $1,500 | $3,150 |
| 2019 | $205 | $4,650 | $1,500 | $3,150 |
| 2018 | $205 | $4,650 | $1,500 | $3,150 |
| 2017 | $205 | $4,650 | $1,500 | $3,150 |
| 2016 | $205 | $4,650 | $1,500 | $3,150 |
| 2015 | $194 | $4,650 | $1,500 | $3,150 |
| 2014 | $178 | $4,275 | $1,500 | $2,775 |
Source: Public Records
Map
Nearby Homes