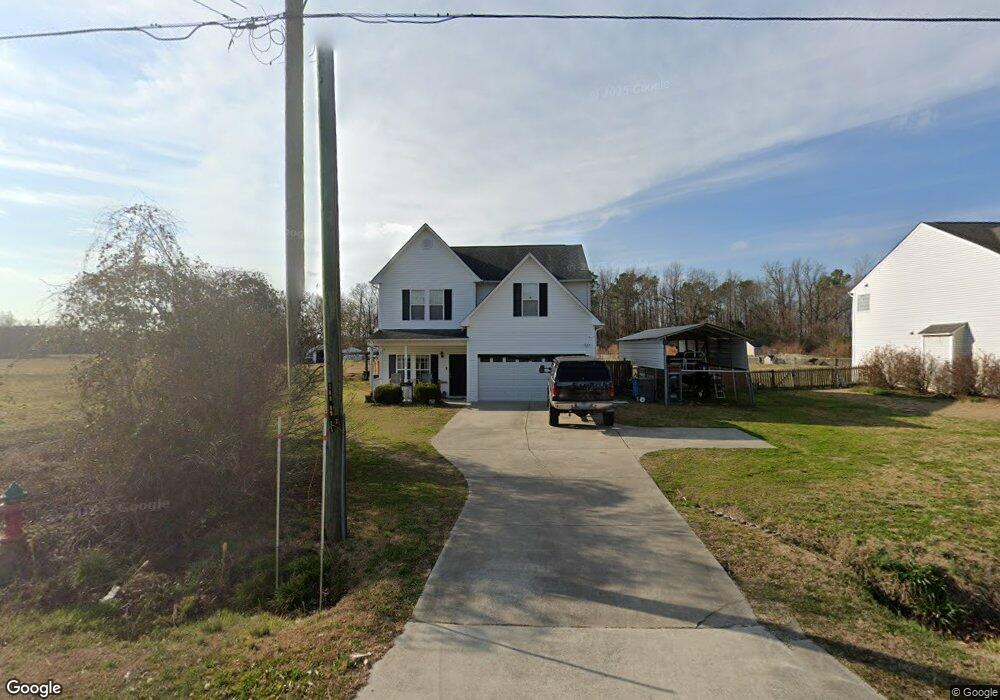
513 Huffmantown Rd Richlands, NC 28574
Estimated Value: $310,000 - $357,000
3
Beds
3
Baths
2,240
Sq Ft
$146/Sq Ft
Est. Value
About This Home
This home is located at 513 Huffmantown Rd, Richlands, NC 28574 and is currently estimated at $327,075, approximately $146 per square foot. 513 Huffmantown Rd is a home located in Onslow County with nearby schools including Richlands Elementary School, Trexler Middle School, and Richlands High School.
Ownership History
Date
Name
Owned For
Owner Type
Purchase Details
Closed on
Sep 18, 2017
Sold by
Whitlaw Nathaniel Olmstead and Whitlaw Stephanie Shaw
Bought by
Whitlaw Nathaniel Olmstead and Whitlaw Stephanie Shaw
Current Estimated Value
Purchase Details
Closed on
Mar 10, 2015
Sold by
Brown Preston L and Brown Vicki F
Bought by
Williams William Joseph
Home Financials for this Owner
Home Financials are based on the most recent Mortgage that was taken out on this home.
Original Mortgage
$163,000
Interest Rate
3.69%
Mortgage Type
Seller Take Back
Purchase Details
Closed on
Feb 12, 2007
Sold by
Rhc Construction & Realty Inc
Bought by
Williams William J and Williams Danielle M
Home Financials for this Owner
Home Financials are based on the most recent Mortgage that was taken out on this home.
Original Mortgage
$182,598
Interest Rate
6.16%
Mortgage Type
Purchase Money Mortgage
Create a Home Valuation Report for This Property
The Home Valuation Report is an in-depth analysis detailing your home's value as well as a comparison with similar homes in the area
Home Values in the Area
Average Home Value in this Area
Purchase History
| Date | Buyer | Sale Price | Title Company |
|---|---|---|---|
| Whitlaw Nathaniel Olmstead | -- | None Available | |
| Williams William Joseph | $175,000 | None Available | |
| Williams William J | $180,000 | None Available |
Source: Public Records
Mortgage History
| Date | Status | Borrower | Loan Amount |
|---|---|---|---|
| Closed | Williams William Joseph | $163,000 | |
| Previous Owner | Williams William J | $182,598 |
Source: Public Records
Tax History Compared to Growth
Tax History
| Year | Tax Paid | Tax Assessment Tax Assessment Total Assessment is a certain percentage of the fair market value that is determined by local assessors to be the total taxable value of land and additions on the property. | Land | Improvement |
|---|---|---|---|---|
| 2025 | $1,310 | $244,925 | $27,750 | $217,175 |
| 2024 | $1,310 | $244,925 | $27,750 | $217,175 |
| 2023 | $1,310 | $244,925 | $27,750 | $217,175 |
| 2022 | $1,310 | $244,925 | $27,750 | $217,175 |
| 2021 | $1,009 | $188,140 | $20,350 | $167,790 |
| 2020 | $1,009 | $188,140 | $20,350 | $167,790 |
| 2019 | $962 | $181,470 | $20,350 | $161,120 |
| 2018 | $962 | $181,470 | $20,350 | $161,120 |
| 2017 | $918 | $181,070 | $20,350 | $160,720 |
| 2016 | $1,319 | $195,365 | $0 | $0 |
| 2015 | $1,329 | $196,955 | $0 | $0 |
| 2014 | $1,341 | $198,720 | $0 | $0 |
Source: Public Records
Map
Nearby Homes
- 517 Huffmantown Rd
- 502 Huffmantown Rd
- 510 Huffmantown Rd
- 495 Huffmantown Rd
- 518 Huffmantown Rd
- 496 Huffmantown Rd
- 522 Huffmantown Rd
- 121 Cox Rd
- 526 Huffmantown Rd
- 531 Huffmantown Rd
- 484 Huffmantown Rd
- 534 Huffmantown Rd
- 112 Cox Rd
- 541 Huffmantown Rd
- 540 Huffmantown Rd
- 476 Huffmantown Rd
- 550 Huffmantown Rd
- 140 Cox Rd
- 557 Huffmantown Rd
- 121 Petersburg Rd